Mapped: The 10 Hottest and Coldest Countries in the World

Published

1 min ago

on

June 15, 2024 Article/Editing:

See this visualization first on the Voronoi app.

Mapped: The 10 Hottest and Coldest Countries in the World

This was originally posted on our Voronoi app. Download the app for free on iOS or Android and discover incredible data-driven charts from a variety of trusted sources.

This visualization shows the world’s hottest and coldest countries (and some territories) by their average temperature in 2022. Data for both the graphic and article has been sourced from the World Bank, accessed via Trading Economics.

Ranked: Average Temperature in 2022, by Country or Territory

Burkina Faso’s average annual temperature stands just past 29 °C (84.7 °F), making it the hottest country by this metric.

RankCountryAverage Temperature
(2022, °C)Average Temperature
(2022, °F) 1🇧🇫 Burkina Faso29.384.7 2🇲🇱 Mali29.284.6 3🇶🇦 Qatar29.184.4 4🇸🇳 Senegal29.084.2 5🇦🇪 UAE28.984.0 6🇲🇷 Mauritania28.984.0 7🇧🇭 Bahrain28.883.8 8🇦🇼 Aruba28.883.8 9🇩🇯 Djibouti28.683.5 10🇬🇲 Gambia28.583.3 11🇧🇯 Benin28.182.6 12🇲🇻 Maldives28.182.6 13🇬🇼 Guinea-Bissau28.182.6 14🇰🇾 Cayman Islands28.082.4 15🇴🇲 Oman27.982.2 16🇲🇭 Marshall Islands27.982.2 17🇰🇮 Kiribati27.882.0 18🇬🇭 Ghana27.781.9 19🇸🇬 Singapore27.781.9 20🇳🇪 Niger27.681.7 21🇰🇼 Kuwait27.681.7 22🇸🇩 Sudan27.681.7 23🇬🇺 Guam27.581.5 24🇵🇼 Palau27.581.5 25🇼🇸 Samoa27.581.5 26🇹🇬 Togo27.581.5 27🇫🇲 Micronesia27.581.5 28🇰🇳 St Kitts & Nevis27.381.1 29🇦🇸 American Samoa27.381.1 30🇹🇩 Chad27.381.1 31🇰🇭 Cambodia27.381.1 32🇲🇵 Northern Mariana Islands27.381.1 33🇱🇰 Sri Lanka27.281.0 34🇳🇬 Nigeria27.281.0 35🇸🇨 Seychelles27.180.8 36🇸🇴 Somalia27.180.8 37🇦🇬 Antigua and Barbuda27.180.8 38🇨🇮 Ivory Coast26.880.2 39🇻🇮 Virgin Islands26.880.2 40🇱🇨 St Lucia26.880.2 41🇹🇭 Thailand26.880.2 42🇩🇲 Dominica26.780.1 43🇸🇱 Sierra Leone26.679.9 44🇵🇭 Philippines26.679.9 45🇸🇷 Suriname26.579.7 46🇪🇷 Eritrea26.579.7 47🇸🇦 Saudi Arabia26.579.7 48🇹🇹 Trinidad and Tobago26.579.7 49🇧🇧 Barbados26.579.7 50🇲🇾 Malaysia26.479.5 51🇬🇩 Grenada26.379.3 52🇬🇾 Guyana26.279.2 53🇨🇺 Cuba26.179.0 54🇧🇸 Bahamas26.179.0 55🇯🇲 Jamaica26.078.8 56🇻🇨 St Vincent & the Grenadines26.078.8 57🇮🇩 Indonesia26.078.8 58🇬🇳
Mapped: The World’s Wettest and Driest Countries

Published

2 mins ago

on

May 24, 2024 Graphics/Design:

See this visualization first on the Voronoi app.

Where are the World’s Wettest and Driest Countries?

This was originally posted on our Voronoi app. Download the app for free on iOS or Android and discover incredible data-driven charts from a variety of trusted sources.

From tropical rainforest nations to the sandy deserts of North Africa and the Middle East, the world’s wettest and driest countries are a study in contrasts.

We map and rank the countries that receive the highest and lowest average annual precipitation in millimeters, per latest data from the World Bank.

Ranked: Top 10 Wettest Countries

Colombia tops the list of nations with the highest average precipitation at 3,240 millimeters (128 inches) in a year.

Its Tutunendo district is the one of the world’s wettest places, averaging nearly 12,000 mm (463 inches) of rain annually.

RankCountryAverage Annual
Precipitation (mm) 1Colombia3,240 2Sao Tome & Principe3,200 3Papua New Guinea3,142 4Solomon Islands3,028 5Panama2,928 6Costa Rica2,926 7Samoa2,880 8Malaysia2,875 9Brunei2,722 10Indonesia2,702
Note: Figures are rounded.

Off the coast of Africa however, Sao Tome & Principe is not far behind Colombia, receiving about 3,200 mm of rain in 2020.

Papua New Guinea and the Solomon Islands also average more than 3,000 mm of rain in a year, and Panama (2,928 mm) rounds out the top five.

Noticeably, all 10 countries lie in close proximity to the equator, and near oceans, where rising hot and humid air leads to abundant rainfall.

Ranked: Top 10 Driest Countries

On the other end of the scale, Egypt records the lowest average annual rainfall across all countries, at 18 mm (0.7 inches). For comparison, Colombia receives nearly 180x the amount of rain Egypt does.

RankCountryAverage Annual
Precipitation (mm) 1Egypt18 2Libya56 3Saudi Arabia59 4Qatar74 5UAE78 6Bahrain83 7Algeria89 8Mauritania92 9Jordan111 10Kuwait121
Note: Figures are rounded.

In fact, countries from North Africa and the Middle East make up the entirety of this list of the driest countries in the world.

Learn

MENA: Our new outlook and upgraded coverage for a region at a crossroads Copy

Leer en Español

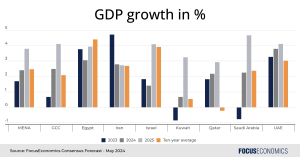
The Middle East and North Africa (MENA) is at a crossroads, both economically and politically. A war ravages the Levant, inflicting immense human suffering and threatening to boil over into a wider regional conflict. But despite the war, the MENA economy remains one of the world’s most promising. Regional powers, such as Saudi Arabia, are pushing for a political settlement to the conflict that would guarantee longer-term peace and stability. Riyadh and neighboring capitals are impatient to continue sowing the seeds of their countries’ future economic success: In 2022, the MENA economy grew at the fastest rate since the early 2000s, and the non-oil sector’s share of GDP among Gulf countries was up 9 percentage points from a decade ago. 

Our new outlook on the region

To reflect the MENA region’s growing clout, this month we penned a fresh outlook for the region’s economy over 2024–2028. The report is free and covers our Consensus Forecasts for GDP growth, oil and non-oil output, inflation and the fiscal balance. 

Our upgraded coverage of the region

In addition, this month we also upgraded our coverage of Qatar and Kuwait, two of the region’s most promising economies. Our coverage now features dedicated written analysis for both countries on high-frequency economic data―written by our in-house team of economists―including GDP, purchasing managers’ index readings, industrial production, oil production, and inflation. As well as this, our coverage now includes quarterly forecasts for GDP growth and inflation for both Qatar and Kuwait, as well as monthly data for oil production, industrial production and purchasing managers’ index readings. Finally, our coverage contains new detailed charts and panelist breakdowns for additional indicators for both countries, including private consumption, total investment, public debt, exports and imports.    


Insight from our panelists

On the outlook for regional GDP growth, analysts at Fitch Solutions said: 

“The MENA region’s growth will slightly accelerate from 1.9% in 2023 to 2.4% in 2024 but face major headwinds from the Israel-Hamas war, slower growth in key economies, and the Red Sea crisis. The GCC will see growth accelerate from 0.6% to 2.6% in 2024, driven by normalisation of oil production and strong non-hydrocarbon sector performance, particularly due to investment in diversification efforts. Growth