Visualized: Mid-Year Interest Rate Cut Forecasts for 2024

Published

15 seconds ago

on

July 2, 2024 Article/Editing: Graphics/Design:

See this visualization first on the Voronoi app.

Mid-Year Interest Rate Cut Forecasts for 2024

This was originally posted on our Voronoi app. Download the app for free on iOS or Android and discover incredible data-driven charts from a variety of trusted sources.

Today, many institutions are trimming back their rate cut expectations given strong labor market data and slow progress on inflation.

At the beginning of 2024, several banks forecasted five or more interest rate cuts over the year, while the median projection for Federal Reserve policymakers was three quarter-point cuts by fiscal year-end in March. Now, it has pared this back to one rate cut this year.

This graphic shows mid-year interest rate forecasts, based on institution reports via Nick Timiraos of the Wall Street Journal.

Will the Fed Cut Interest Rates This Year?

Below, we show interest rate forecasts across 21 institutions as of June 2024:

Forecasted Rate Cuts
in 2024Number of Institutions
as of JuneNumber of Institutions
as of AprilNames of Institutions 0 bps31Jefferies, Mizuho, Societe Generale 25 bps80Bank of America, Barclays, BNP Paribas,
Deutsche Bank, HSBC, JP Morgan,
LH Meyer, RBC 50 bps71Evercore ISI, Goldman Sachs, Nomura,
Oxford Economics, TD Securities, UBS,
Wells Fargo 75 bps29Citigroup, Morgan Stanley 100 bps15MUFG 125 bps03N/A

Overall, more than half of the institutions seen in the above table anticipate the first rate cut to take place in September.

Citigroup, for example, is forecasting quarter-point rate cuts in September, November, and December. In June, the bank scaled back their projections, which were previously calling for four cuts beginning in July. A key indicator that the bank is watching is the unemployment rate, which slowly increased to 4% in May, up from 3.9% a month earlier. It also expects inflation to continue cooling over the coming months.

Like Citigroup, Goldman Sachs and Nomura see the first rate cut taking place in September.

In more of a hawkish camp, JP Morgan anticipates the first cut to be in November due to continued momentum in the labor market. This year, the bank has shifted from three interest rate cuts to one, citing that job weakness may take several months to play

What History Reveals About Interest Rate Cuts

Published

1 hour ago

on

May 23, 2024 Graphics & Design What History Reveals About Interest Rate Cuts

The Federal Reserve has overseen seven cycles of interest rate cuts, averaging 26 months and 6.35 percentage points (ppts) each.

We’ve partnered with New York Life Investments to examine the impact of interest rate cut cycles on the economy and on the performance of financial assets in the U.S. to help keep investors informed. 

A Brief History of Interest Rate Cuts

Interest rates are a powerful tool that the central bank can use to spur economic activity. 

Typically, when the economy experiences a slowdown or a recession, the Federal Reserve will respond by cutting interest rates. As a result, each of the previous seven rate cut cycles—shown in the table below—occurred during or around U.S. recessions, according to data from the Federal Reserve. 

Interest Rate Cut CycleMagnitude (ppts) July 2019–April 2020-2.4 July 2007–December 2008-5.1 November 2000–July 2003-5.5 May 1989–December 1992-6.9 August 1984–October 1986-5.8 July 1981–February 1983-10.5 July 1974–January 1977-8.3 Average-6.4

Understanding past economic and financial impacts of interest rate cuts can help investors prepare for future monetary policy changes.

The Economic Response: Inflation

During past cycles, data from the Federal Reserve, shows that, on average, the inflation rate continued to decline throughout (-3.4 percentage points), largely due to the lagged effects of a slower economy that normally precedes interest rate declines. 

CycleStart to end change (ppts)End to one year later (ppts) July 2019–April 2020-1.5+3.8 July 2007–December 2008-2.3+2.6 November 2000–July 2003-1.3+0.9 May 1989–December 1992-2.5-0.2 August 1984–October 1986-2.8+3.1 July 1981–February 1983-7.3+1.1 July 1974–January 1977-6.3+1.6 Average-3.4+1.9

However, inflation played catch-up and rose by +1.9 percentage points one year after the final rate cut. With lower interest rates, consumers were incentivized to spend more and save less, which led to an uptick in the price of goods and services in six of the past seven cycles. 

The Economic Response: Real Consumer Spending Growth

Real consumer spending growth, as measured by the Bureau of Economic Analysis, typically reacted to rate

How Inflation Changed UK Saving and Spending Habits

The cost-of-living shock has turned the UK from a nation of spenders into savers, according to a think tank.

The “tumultuous period of price change” has changed what households do with their money, with consumption being cut by more than the fall in incomes, the Resolution Foundation said.

Official data released next week looks set to show inflation returning to close to the 2% target, drawing a line under a three-year inflation spike that has left households spending less and saving more, the Foundation said.

With consumer price infex inflation for April expected to fall within touching distance of the Bank of England’s 2% target, the Foundation looked at how the inflation squeeze has affected living standards, spending behaviour and finances.

CPI inflation peaked at 11.1% in October 2022, and since March 2021 overall prices have increased by 22%, researchers said.

CPI inflation rose by 3.2% in the 12 months to March 2024, down from 3.4% in February, according to Office for National Statistics data.

The UK squeezed more than a decade’s worth of “normal” inflation into just three years, according to the Foundation, which is focused on improving the living standards for those on low to middle incomes.

Spending Cut Dramatically

The cost of essentials has risen particularly quickly, putting poorer households at the heart of the crisis, as a bigger proportion of their spending goes on essentials, researchers added.

The Foundation said that households generally have cut down sharply on the amount they consume during the cost-of-living crisis.

The surge in inflation has eroded the value of earnings. Real household disposable income per person has fallen by 1.1%, or £280 a year, since just before the coronavirus pandemic, the fourth quarter of 2019, but real consumption per person has fallen much further, by 4.7%, or £1,200 a year.

In the last three months of 2023, families saved 6% of their disposable incomes – the highest rate outside of the pandemic in more than 30 years – researchers said.

The report said: “Although it is definitely good news that the headline inflation rate is normalising, we have still experienced a huge inflation shock, the largest in at least two generations.

“Big changes in overall prices – and even bigger changes in the relative price of energy and food – remain with us. This means we now need to spend more on essentials, or consume less, than we used to.

“In

Has the Euro area escaped its low-inflation trap for good?

Leer en Español

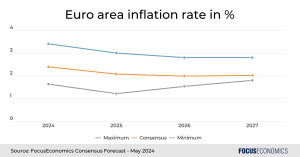
For much of the 2010s, inflation in Euro area countries undershot the European Central Bank’s 2.0% target, due to a combination of domestic factors—chiefly weak demand—and external factors, such as peak globalization and depressed oil prices from 2015 onwards. That all changed after the end of the Covid-19 pandemic, with global supply chains snarling up as demand recovered rapidly; inflation has now overshot the ECB’s target for over two years. But what does the future hold for inflation in Euro area countries? 

Inflation in Euro area countries expected to meet target

Our Consensus is for inflation in Euro area countries to finally converge to the 2.0% target by the middle of next year, and to then remain roughly steady on average over the medium to long term. This would be a notable increase from the 1.4% average in the 2010s. There is a large discrepancy among our panelists though: Average inflation forecasts for 2025 range from 1.2% to 3.0%, while those for 2026 range from 1.5% to 2.8% for instance. 

Multiple factors will drive price pressures

The EU’s push away from Russian gas and toward clean energy will raise costs for industry and consumers, as will rising global protectionism and a general desire among countries to boost supply chain security over out-and-out efficiency. Plus, the EU labor market is forecast to remain tight in coming years amid population aging, with our panelists forecasting wage growth around 50% higher than during the 2010s as a result; this will prop up inflation in Euro area countries in turn. 

Upside risks to inflation abound

Escalating tensions between the EU and China are a key upside risk to inflation. The bloc could impose tariffs on Chinese electric vehicle imports later this year, and has recently launched investigations into several other aspects of China-EU trade relations. Then there is a potential Donald Trump win in the U.S. presidential elections this November: He has threatened to impose tariffs on all imports, which could lead Europe to retaliate by raising its own trade barriers in turn. And conflicts in the Middle East and Ukraine could intensify, disrupting global shipping as well as oil and agricultural output. So while inflation in Euro area countries is set to return to target, don’t bank on it staying

Visualizing Global Inflation Forecasts (2024-2026)

Published

2 hours ago

on

May 3, 2024 Article/Editing: Graphics/Design:

Visualizing Global Inflation Forecasts (2024-2026)

Global inflation rates are gradually descending, but progress has been slow.

Today, the big question is if inflation will decline far enough to trigger easing monetary policy. So far, the Federal Reserve has held rates for nine months amid stronger than expected core inflation, which excludes volatile energy and food prices.

Yet looking further ahead, inflation forecasts from the International Monetary Fund (IMF) suggest that inflation will decline as price pressures ease, but the path of disinflation is not without its unknown risks.

This graphic shows global inflation forecasts, based on data from the April 2024 IMF World Economic Outlook.

Get the Key Insights of the IMF’s World Economic Outlook

Want a visual breakdown of the insights from the IMF’s 2024 World Economic Outlook report?

This visual is part of a special dispatch of the key takeaways exclusively for VC+ members.

Get the full dispatch of charts by signing up to VC+.

The IMF’s Inflation Outlook

Below, we show the IMF’s latest projections for global inflation rates through to 2026:

YearGlobal Inflation Rate (%)Advanced Economies
Inflation Rate (%)Emerging Market and
Developing Economies
Inflation Rate (%) 20193.51.45.1 20203.20.75.2 20214.73.15.9 20228.77.39.8 20236.84.68.3 20245.92.68.3 20254.52.06.2 20263.72.04.9

After hitting a peak of 8.7% in 2022, global inflation is projected to fall to 5.9% in 2024, reflecting promising inflation trends amid resilient global growth.

While inflation has largely declined due to falling energy and goods prices, persistently high services inflation poses challenges to mitigating price pressures. In addition, the IMF highlights the potential risk of an escalating conflict in the Middle East, which could lead to energy price shocks and higher shipping costs.

These developments could negatively affect inflation scenarios and prompt central banks to adopt tighter monetary policies. Overall, by 2026, global inflation is anticipated to decline to 3.7%—still notably above the 2% target set by several major economies.

Adding to this, we can see divergences in the path of inflation between advanced and emerging economies. While affluent nations are forecast to see inflation edge closer to the 2% target by 2026, emerging economies are projected to have inflation rates