All of the World’s Trillion-Dollar Companies in One Chart

Published

1 hour ago

on

June 19, 2024 Graphics/Design:

See this visualization first on the Voronoi app.

All of the World’s Trillion-Dollar Companies in One Chart

This was originally posted on our Voronoi app. Download the app for free on iOS or Android and discover incredible data-driven charts from a variety of trusted sources.

Chipmaker Nvidia is now the world’s most valuable company, which means its time for an update to our frequent “trillion-dollar club” post.

In this graphic, we’ve visualized the market capitalizations of the world’s trillion-dollar companies, as of June 18, 2024. Included for additional context is the market cap of the median S&P 500 firm (as of May 30, 2024), as well as Taiwan’s TSMC, which is the next closest company to reaching the $1 trillion milestone.

Data and Key Takeaways

The figures used to create this graphic are included in the table below. Numbers for each company come from Companiesmarketcap.com, while the median S&P 500 market cap was sourced from S&P Global.

CompanyMarket Cap (USD) 🇺🇸 Nvidia$3.34T 🇺🇸 Microsoft$3.32T 🇺🇸 Apple$3.29T 🇺🇸 Alphabet$2.17T 🇺🇸 Amazon$1.90T 🇸🇦 Saudi Aramco$1.79T 🇺🇸 Meta$1.27T 🇹🇼 TSMC$932B Median S&P 500 company$92B

Here are the key reasons behind each of these companies’ massive valuations:

Nvidia: Industry leader in data center chips, essential for training artificial intelligence Microsoft: Dominance in enterprise software products (e.g. Windows, Office, Azure) Apple: Strong track record of innovation and a large, loyal customer base Alphabet: Leading player in online advertising and other digital platforms (e.g. Google Search, Youtube) Amazon: Dominance in e-commerce and rising cloud computing market share through Amazon Web Services (AWS) Saudi Aramco: World’s largest oil producer with massive reserves Meta: Dominant player in social media (Facebook, Instagram, Whatsapp)

If you’re interested in learning more, check out our graphic: Visualizing How Big Tech Companies Make Their Billions.

Which Company Will Hit $1 Trillion Next?

As of June 18, there are a few candidates that could soon join the trillion-dollar club, including TSMC ($932B), Berkshire Hathaway ($881B), Eli Lilly ($847B), and Broadcom ($839B).

Most of these stocks have climbed significantly in 2024 so far, with TSMC up 77% since the start of
In Search of the Exclusion Premium

Cheng-En Li, Research Analyst at MainStreet Partners, explores how market performance of large-cap companies is influenced by poor ESG practices.

While grappling with uncertainty in capital markets caused by the exacerbation in inflation, mounting policy rates, and geopolitical tensions in 2023 and 2024, many institutions are now looking to align themselves more closely with good ESG practices in response to increased regulation and market demand. But a question in the mind of any investor is how ESG-related controversial behaviours can affect performance over the medium term.

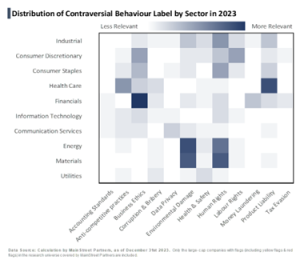
Recently, we conducted research analysing data from 2023 to investigate this relationship between ESG behaviour and capital market performance, using the MSCI ACWI large-cap index as a benchmark. The study first examined whether the share prices of companies flagged for negative ESG behaviour show any discernible trends over the ensuing six months and over the full year in 2023. We then analysed the distribution of companies that have been flagged to determine if certain industries are more prone to ESG-related controversies.

Furthermore, leveraging sector return data, we assessed the performance implications of flagged companies in various industries, examining whether such industries underperform and if there is evidence of an ‘exclusion premium’. This is when outperformance is generated by ‘being selective’ and excluding companies with relevant ESG-related controversial behaviour.

Finally, we created sub-universes based on different ESG flags to explore how incorporating ESG behaviour into investment strategies can enhance performance and mitigate risk.

The findings indicate that this approach may affect the risk and return profiles of large-cap firms.

Negative impact of ESG controversies

ESG controversies/negative ESG behaviour refers to company practices that raise ethical, environmental or social concerns. We developed a framework to classify controversial events based on severity. The framework has five key performance indicators — scale, frequency, response, effectiveness, and transparency — to rate the news for the company with numeric score (ie, severity score) ranging from one to five; the company is assigned a yellow flag/red flag once the severity score exceeds the corresponding threshold.

We would then issue a red flag to a company that has engaged in any controversy that poses a significant threat to the company’s business and future performance, alternatively issuing a yellow flag to a company if the controversy is likely to develop into a material ESG risk.

Among the companies that were newly flagged in 2023, those with controversies over accounting standards and human rights

Comparing Saudi Aramco’s $1.9T Valuation to Its Rivals

Published

11 seconds ago

on

May 31, 2024 Graphics/Design:

See this visualization first on the Voronoi app.

Putting Saudi Aramco’s Market Cap Into Perspective

This was originally posted on our Voronoi app. Download the app for free on iOS or Android and discover incredible data-driven charts from a variety of trusted sources.

As of May 2024, there are just six trillion-dollar companies in the world, and only one of them is an oil company.

In this graphic, we put Saudi Aramco’s market cap into perspective by comparing it to the rest of the world’s largest oil companies. Numbers were sourced from Companiesmarketcap.com, and are as of May 24, 2024.

Data and Takeaways

The data we used to create this graphic are listed in the table below.

CompanyMarket Cap
(as of May 24, 2024) 🇸🇦 Saudi Aramco$1,914B 🇺🇸 Exxon Mobil$509B 🇺🇸 Chevron$288B 🇨🇳 Petro China$243B 🇳🇱 Shell$225B 🇫🇷 TotalEnergies$165B 🇺🇸 ConocoPhillips$137B 🇬🇧 BP$103B 🇨🇳 Sinopec$102B

Saudi Aramco launched its initial public offering (IPO) on December 11, 2019. It remains the largest IPO in history, raising $25.6 billion and valuing the company at $1.7 trillion. Aramco is also the only trillion-dollar company that isn’t based in the United States.

As of 2022, Aramco had proven reserves equal to 259 billion barrels of oil equivalent, which is massively greater than rivals like ExxonMobil (17.7 billion) and Chevron (11.2 billion).

$1.9T*

It should be noted that the Saudi government directly owns 90% of the company, while another 8% is held by the country’s sovereign wealth fund. With only 2% of shares available to the public, some believe that the company’s current valuation carries little weight.

For example, a Bloomberg op-ed from 2023 described Aramco’s valuation as an “illusion” due to its very low trading volume. Over a one year period, Aramco’s average daily turnover was just $51 million, compared to $1.9 billion for ExxonMobil and $1.4 billion for Chevron.

See More Market Cap Comparisons from Visual Capitalist

If you enjoyed this graphic, be sure to check out our similar graphic covering Nvidia.

Visualizing Berkshire Hathaway’s Stock Portfolio (Q1 2024)

Published

2 hours ago

on

May 27, 2024 Graphics/Design:

See this visualization first on the Voronoi app.

Visualizing Berkshire Hathaway’s Portfolio as of Q1 2024

This was originally posted on our Voronoi app. Download the app for free on iOS or Android and discover incredible data-driven charts from a variety of trusted sources.

Wondering what the Oracle of Omaha has his money invested in?

In this graphic, we illustrate Berkshire Hathaway’s portfolio holdings, as of Q1 2024. This data was released on May 15, 2024, and can be easily accessed via CNBC’s Berkshire Hathaway Portfolio Tracker.

The value of each position listed in this graphic is based on market prices as of May 23, 2024, and will change over time.

Furthermore, note that Berkshire has received SEC permission to temporarily withhold data on certain positions. This includes all of its Japanese stocks, which are reported as of June 12, 2023.

It’s (almost) all Apple

The data we used to create this graphic can be found in the following table. Positions worth less than $5 billion were included in “Other”.

Company% of PortfolioValue
(As of 05-23-2024) 🇺🇸 Apple Inc39.7$149.8B 🇺🇸 Bank of America10.7$40.6B 🇺🇸 American Express9.7$36.8B 🇺🇸 Coca-Cola6.7$25.2B 🇺🇸 Chevron5.3$20.0B 🇺🇸 Occidental Petroleum4.2$15.7B 🇺🇸 Kraft Heinz3.1$11.7B 🇺🇸 Moody’s2.7$10.2B 🇯🇵 Mitsubishi Corp2.1$7.8B 🇺🇸 Chubb1.9$7.1B 🇯🇵 Mitsui & Co1.7$6.4B 🇯🇵 Itochu Corporation1.5$5.5B 🇺🇸 DaVita1.3$5.0B 🌍 Other9.4$35.9B Total100$377.9B

From this, we can see that Berkshire’s largest position is Apple, which makes up almost 40% of the portfolio and is worth nearly $150 billion.

While Warren Buffett once referred to Apple as the best business in the world, his firm actually trimmed its position by 13% in Q1 2024.

Even after that cut, Berkshire still maintains a 5.1% ownership stake in Apple.

Why Japanese Stocks?

While most of Berkshire’s major positions are in American companies, Japanese firms make up a significant chunk.

In 2020, Berkshire took positions in five Japanese trading houses: Itochu, Marubeni, Mitsubishi, Mitsui, and Sumitomo.

Also known as sōgō shōsha, which translates to “general trading company”, these firms are highly diversified across major

Nvidia is Worth More Than All of These Companies Combined

Published

36 seconds ago

on

May 27, 2024 Graphics/Design:

See this visualization first on the Voronoi app.

Putting the Market Cap of Nvidia Into Perspective

This was originally posted on our Voronoi app. Download the app for free on iOS or Android and discover incredible data-driven charts from a variety of trusted sources.

Nvidia’s massive rise in the AI era has been well-documented, but did you know that it’s currently the world’s third most valuable company?

To put the massive market cap of Nvidia into perspective, we’ve put it side by side with a collection of other major U.S. tech companies.

All figures were sourced from Companiesmarketcap.com, and are as of May 23, 2024.

Advertisement
Data and Takeaways

All of the numbers we used to create this graphic are included in the table below.

CompanyMarket Cap
(as of May 23, 2024) Nvidia$2.5T Meta$1.2T Tesla$553B Netflix$272B AMD$257B Intel$128B IBM$157B

These figures are even more impressive when you consider that at the beginning of 2020, Nvidia was valued at a relatively tiny $145 billion.

Since then, the company has greatly surpassed other American chipmakers like Intel and AMD. This growth is due to several key factors:

Expansion into AI and data centers: Nvidia’s chips are highly effective for AI training, making them essential for companies engaged in machine learning and generative AI Advancements in AI software: Nvidia has developed AI software platforms, such as CUDA-X and TensorRT, which are widely used by researchers. Strong financial performance: Nvidia has consistently delivered strong financial results in recent years, with substantial revenue growth. Closing in on Apple

With Nvidia’s latest stock surge (up 13.5% over the past five days ending May 24, 2024), the company could possibly overtake Apple to become the world’s second most valuable company.

Microsoft, another major player in AI, holds the #1 spot with a market cap of $3.2 trillion.

See More Visuals on Nvidia

If you enjoyed this graphic, be sure to check out this graphic that breaks down Nvidia’s revenue by product line, from 2019 to 2024.

Advertisement

The Growth of a $1,000 Equity Investment, by Stock Market

Published

2 hours ago

on

May 6, 2024 Graphics/Design:

See this visualization first on the Voronoi app.

Visualizing Stock Market Growth by Country

This was originally posted on our Voronoi app. Download the app for free on iOS or Android and discover incredible data-driven charts from a variety of trusted sources.

In this graphic, we show the change in value of a $1,000 investment in various leading equity indexes from around the world. This data was sourced from Investing.com, and covers a five-year period from April 2019 to April 2024.

See the following table for the five-year annual return figures of the indexes shown above.

Index5-Yr Return
as of April 1, 2024 🇮🇳 NIFTY 5092.4% 🇯🇵 Nikkei 22572.5% 🇺🇸 S&P 50070.9% 🇨🇦 S&P/TSX Composite31.0% 🇬🇧 FTSE 1009.8% 🇭🇰 Hang Seng-40.2%

In terms of stock market growth by country, India (represented here by the NIFTY 50) has impressively surpassed both the U.S. and Japan.

What is the NIFTY 50?

The NIFTY 50 is an index of the 50 largest and most actively traded Indian stocks. Similar to the S&P 500, it represents a range of industries and acts as a benchmark for investors to gauge the performance of the country’s broader stock market.

What’s Going on in India?

India’s multi-year bull market has led to several records being shattered in 2023. For example, the country’s total stock market market capitalization surpassed $4 trillion for the first time, while India-focused ETFs pulled in net inflows of $8.6 billion over the year.

A primary driver of this growth is the country’s fast-rising middle class. According to a report by Morgan Stanley, this “once-in-a-generation shift” will result in India having the third largest stock market globally by 2030, presumably behind the U.S. and China.

Japan Also Breaks Records

Japanese equities (represented in this graphic by the Nikkei 225) slightly outperformed the S&P 500 over the past five years. The index, which represents the top 225 companies on the Tokyo Stock Exchange, recently set a new record high for the first time since 1989.

Japanese companies have reported strong earnings as of late, partly thanks to a weak yen, which benefits many of the country’s export-reliant companies.

Learn

How Investors can Accelerate the Food and Agriculture Revolution

Dr Henning Stein, Finance Fellow at Cambridge Judge Business School, and Ariel Barack, CEO of Ordway Selections, explain why the drivers of change – and the roles of the public and private markets – are evolving.

Efforts to build a genuinely sustainable food and agriculture system have now been under way for a number of years. On the whole, the story so far has reflected an uncomfortable truth: revolutions are messy.

There have been few exceptions to this rule throughout history. Political, social and even scientific upheaval has almost always proved tumultuous, for the simple reason that radical change is seldom easily achieved.

Given this, we should not be surprised that the global transformation of how we produce and consume food has been neither flawless nor swift. Equally, we should not shy away from its imperfect path to date.

There is no denying that some of the setbacks have been jarring. There is also no denying that many investors’ faith in the quest to feed humanity while safeguarding the environment has been undermined.

Other stakeholders have also been left disenchanted. By way of illustration, consider all those who have ‘bet the farm’ – sometimes literally as well as figuratively – on novel technologies whose promise has not yet translated into tangible results.

Yet none of this means we are in the midst of a revolution that is doomed to fail. Rather, it means we are still on a steep learning curve.

As investors, we have to understand what has happened, recognise where errors have been made and rethink our approaches. In public and private markets alike, there are important lessons to digest.

The irrefutable case for change

It is first imperative to appreciate why, in spite of limited progress, the investment attractions of sustainable food and agriculture not only remain strong but have arguably increased. This obliges us to see the bigger picture.

The most significant point here is that this is a transition that absolutely has to take place. The policies and practices that have dominated food production and consumption for the past three quarters of a century are no longer fit for purpose.

Incorporating farming, processing and distribution, the food system in its entirety is responsible for around a quarter of all greenhouse gas emissions. In turn, the dire effects of climate change – including extreme weather events, ecological decline and dwindling biodiversity – are ravaging landscapes and