Is The Yield Curve Still Relevant? An Economist Clarifies
Is The Yield Curve Still Relevant? An Economist Clarifies
The Capital Spectator
When the US Treasury yield curve inverts (short rates rise above long rates) the shift is widely viewed as a reliable forecast that a recession is near. But this time has been different, or so it seems. The curve has been inverted since July 2022, the longest inversion on record, but a recession has yet to arrive.
Is the yield curve no longer relevant for business-cycle analysis? Or is this widely-followed signal just slow this time? Actually, it’s neither, explains Robert Dieli, an economist at NoSpinForecast.com, a business-cycle consultancy.
In a series of email exchanges with CapitalSpectator.com, Dieli outlines his views on the yield curve, of which he is a veteran analyst on behalf of his clients. “The last four recessions started after the yield curve inversion was resolved,” he advises. “The signal is not when the curve inverts. The signal is when the curve goes back to its normal shape.”
In the following Q&A, Dieli shares additional thoughts (and charts) on the art/science of interpreting the yield curve for business-cycle analysis.
Q: What set of Treasury yield maturities do you prefer for monitoring the curve?
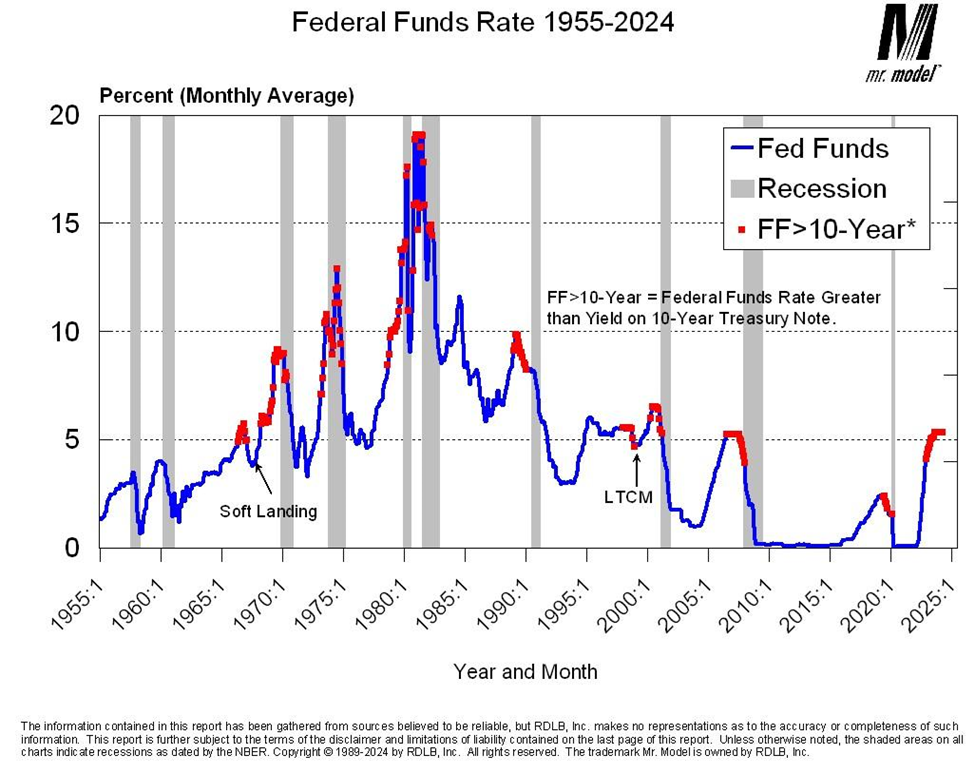
A: My criterion for whether we have an inverted yield curve is the yield on the 10-Year Treasury Note minus the current level of the Federal Funds Rate. In both cases I use the monthly average of each metric. I use the Fed Funds rate because the FOMC has complete control over its level and trend, which means that the duration and severity of a yield curve inversion are largely at their discretion. I use the 10-Year Note both because it has the longest continuous issuance history of the long-maturity securities (both the 20-Year and 30-Year Bonds have had gaps in issuance) and because it is currently the flagship rate in the bond market.
What is the track record for recession warnings for the yield curve when it normalizes after a period of inversion?
This chart shows the record of yield curve inversions going back to 1955. As you can see, we did not have inversions under my criterion, until the mid-1960s. The next two charts address the question you just posed.
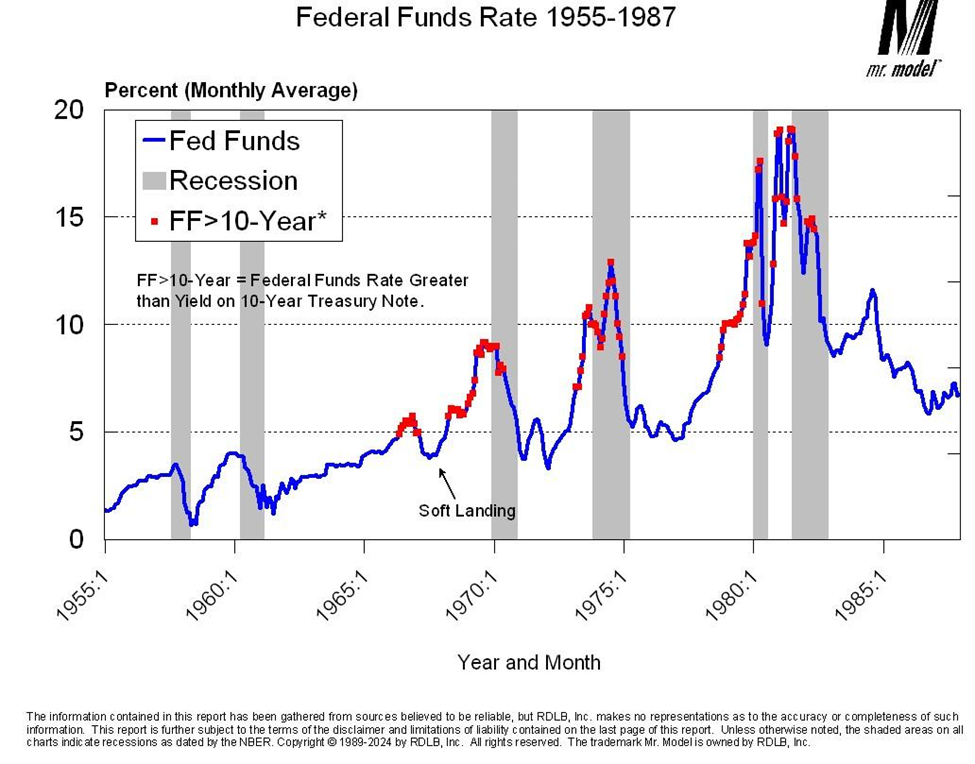
During the period between 1955 and 1987 the curve inversions persisted into the recession periods. Note also that we had a period that I have marked as the “soft landing” where we had an inversion of the curve that was
The full article is available here. This article was published at The Capital Spectator.
Comments are closed for this article!