Guesstimating The Level Of Froth In US Stocks
Guesstimating The Level Of Froth In US Stocks
The Capital Spectator
Calling tops and bottoms in the stock market is the Holy Grail for investing analytics. Alas, success on this front is nearly impossible, at least in terms of timely precision. Yet some of us still venture down this path. Why? Developing perspective helps, even if it’s less than perfect perspective and it’s used judiciously and the caveats are recognized.
The main caveat is summed up in the warning that the market can stay irrational for longer than you can remain liquid. History, after all, is replete with examples of markets that appeared “over-valued” and continued to set new highs, sometimes for years.
Why, then, make the effort to evaluate market conditions in search of clues about future returns? One reason, and one that I find compelling: tracking what appears to be the market cycle is a useful reminder that risk is non-stationary. Another aspect of engaging in this type of analysis is that it forces you to consider your risk tolerance and decisions related to your investment choices, asset allocation, etc.
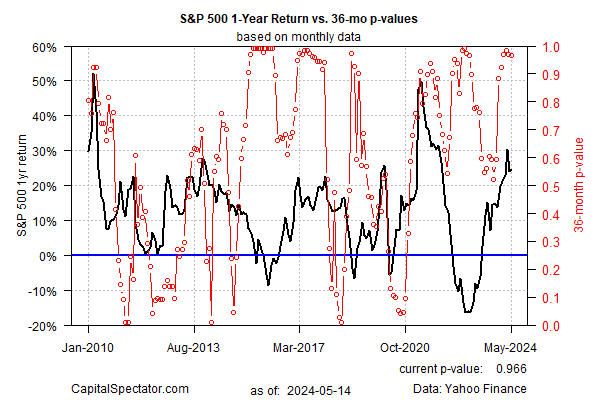
With that in mind, let’s check in on an effort to quantify so-called bubble risk for the S&P 500 (for details, see this post). There are many ways to approach this task and the chart below is but one flavor. The current reading suggests the S&P 500 is overextended.
In fact, that was also the message in early March, when I ran the same analytics. How did that signaling fare? Results are mixed, at best. The following month the market corrected sharply, but has since resumed an upward run and is now close to reaching a new high.
Learn To Use R For Portfolio Analysis
Quantitative Investment Portfolio Analytics In R:
An Introduction To R For Modeling Portfolio Risk and Return
By James Picerno
The frothy picture noted in the chart above finds corroboration in other metrics, such as the CAPE ratio. The question is what, if anything, investors should do in light of the general view that the market seems to be fully valued, if not overvalued?
One answer is to pair longer-term valuation estimates with shorter-term trend profiles. Each is valuable for different reasons for different time horizons. It’s not unusual that one contradicts the other, which applies to current conditions. Indeed, as the chart below indicates, the S&P 500 trend remains bullish. After a brief correction last month, animal spirits have rebounded.
The value
The full article is available here. This article was published at The Capital Spectator.
Comments are closed for this article!