10-Year US Treasury Yield ‘Fair Value’ Estimate: 16 May 2024

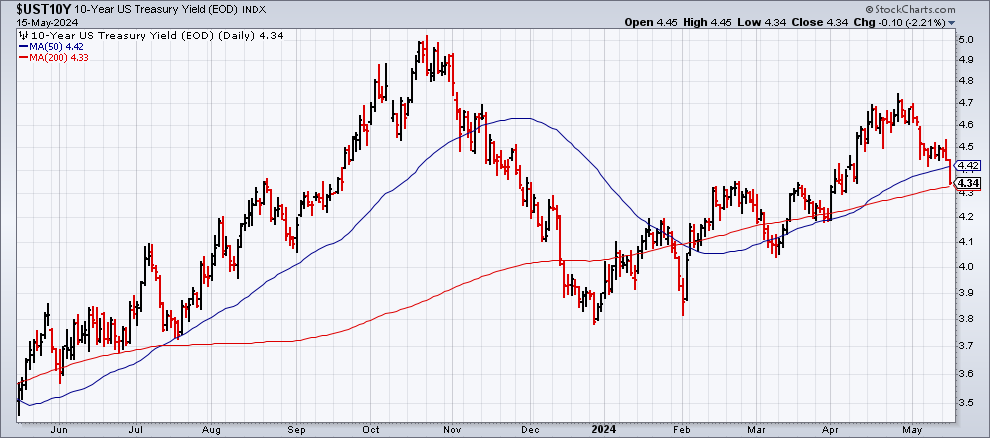
A ‘fair-value’ estimate of the US 10-year Treasury yield was steady in April while the market level for the benchmark rate continued to rise well above the theoretical level. But trading activity this month suggests the trend may be shifting. Yesterday’s sharp fall in the 10-year yield (May 15) substantially narrowed the spread, which implies that the market’s premium over fair value had become extreme.

Following yesterday’s upbeat US consumer inflation news for April, the 10-year yield fell on Wednesday to a six-week low of 4.34%. The slide marks a hefty reversal after this rate climbed to 4.71% at one point in April.

Recall that CapitalSpectator.com’s fair-value estimates for the 10-year yield in recent months have been well below the market rate. As discussed over the past year or so (last month, for example), our modeling suggested that the crowd was pricing in a premium for the 10-year yield that appeared excessive, based on the average estimate for three models (defined here). As a result, the market level looked unsustainable without a dramatic change in the macro fundamentals, such as a sharp rise in inflation. In fact, disinflation, although it stalled recently, persists.

The current fair-value estimate for April is 4.21%, fractionally below the previous month’s level. Based on last month’s data, the market rate rose to a 1.33 percentage-point premium over the average fair-value yield – close to the highest margin since the early 1990s.

How is recession risk evolving? Monitor the outlook with a subscription to:
The US Business Cycle Risk Report

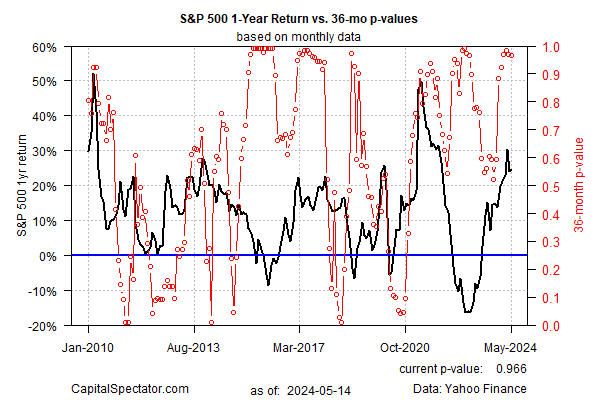
In other words, the market premium baked into the 10-year yield remained lofty last month. Although such extremes aren’t unprecedented, they tend to be relatively short-lived, or so history suggests. As the next chart below reminds, premiums tend to reverse… eventually.

The timing of normalization, as always, is unclear. It’s also worth pointing out that this time could be different, i.e., the market, for whatever reason, maintains a relatively large yield premium for longer than expected. But yesterday’s sharp decline in the market rate for the 10-year yield implies that the premium has started to fade and the history will, in time, repeat.

The thesis on these pages has long been that while the market can maintain a relatively large yield premium for an extended period, the much-lower fair-value estimate will likely restrain the crowd from bidding up the 10-year rate beyond

Guesstimating The Level Of Froth In US Stocks

Calling tops and bottoms in the stock market is the Holy Grail for investing analytics. Alas, success on this front is nearly impossible, at least in terms of timely precision. Yet some of us still venture down this path. Why? Developing perspective helps, even if it’s less than perfect perspective and it’s used judiciously and the caveats are recognized.

The main caveat is summed up in the warning that the market can stay irrational for longer than you can remain liquid. History, after all, is replete with examples of markets that appeared “over-valued” and continued to set new highs, sometimes for years.

Why, then, make the effort to evaluate market conditions in search of clues about future returns? One reason, and one that I find compelling: tracking what appears to be the market cycle is a useful reminder that risk is non-stationary. Another aspect of engaging in this type of analysis is that it forces you to consider your risk tolerance and decisions related to your investment choices, asset allocation, etc.

With that in mind, let’s check in on an effort to quantify so-called bubble risk for the S&P 500 (for details, see this post). There are many ways to approach this task and the chart below is but one flavor. The current reading suggests the S&P 500 is overextended.

In fact, that was also the message in early March, when I ran the same analytics. How did that signaling fare? Results are mixed, at best. The following month the market corrected sharply, but has since resumed an upward run and is now close to reaching a new high.

Learn To Use R For Portfolio Analysis
Quantitative Investment Portfolio Analytics In R:
An Introduction To R For Modeling Portfolio Risk and Return

By James Picerno

The frothy picture noted in the chart above finds corroboration in other metrics, such as the CAPE ratio. The question is what, if anything, investors should do in light of the general view that the market seems to be fully valued, if not overvalued?

One answer is to pair longer-term valuation estimates with shorter-term trend profiles. Each is valuable for different reasons for different time horizons. It’s not unusual that one contradicts the other, which applies to current conditions. Indeed, as the chart below indicates, the S&P 500 trend remains bullish. After a brief correction last month, animal spirits have rebounded.

The value

Disinflation Expected To Resume In April CPI Report

US consumer inflation data was surprisingly firm in March, raising the stakes for tomorrow’s April report (Wed., May 15). Another round of disappointing numbers would arguably confirm that the recent disinflation trend is in serious trouble. No one can rule out that possibility, but I’m expecting we’ll see disinflation will return in some degree.

In particular, the year-over-year change in core CPI is expected to ease to 3.6% through April, based on the point forecast for CapitalSpectator.com’s ensemble model. The prediction interval leaves room for an upside surprise, although the odds that core CPI will accelerate are quite low. The worst-case scenario, according to this modeling, is that core CPI’s 1-year trend holds steady.

Another factor that suggests that disinflation will continue: the lag effects of monetary policy, which have been relatively hawkish over the past two years. Consider how the year-over-year changes in broad M2 money supply (advanced 12 months) compare with the 1-year change in core CPI. As the chart below suggests, the recent negative comparisons in M2 point to more disinflation ahead.

Timing, of course, is open for debate and so the negative 1-year trend in M2 may not be relevant for any given monthly CPI report. What’s more, the M2-CPI chart above raises a warning for the disinflation outlook, namely: time is running out. The net change in the M2 trend is still negative, but the depth of the contraction is fading and looks set to turn positive soon. The implication: monetary policy’s ability to promote a disinflationary bias is fading.

How is recession risk evolving? Monitor the outlook with a subscription to:
The US Business Cycle Risk Report

Meantime, market expectations remain aligned with an ongoing disinflation forecast, or so the policy-sensitive US 2-year Treasury yield suggests. Although this key rate’s implied forecast has been wrong for some time — i.e., that the Federal Reserve will cut interest rates — the crowd is sticking to its dovish outlook, per the ongoing 2-year rate trading well below the current Fed funds rate.

Finally, a simple model using unemployment and headline CPI continue to suggest that monetary policy is tight, which suggests that a disinflationary wind is still blowing.

The acid test, of course, is how the actual CPI results stack up. As it turns out, economists are also projecting that core CPI will ease to a 3.6% year-over-year rate, based on

Commodities And Stocks Are Driving Investment Returns In 2024

April was a rough month for global markets, but commodities and stocks are still the performance leaders for the major asset classes this year, based on a set of ETFs through Friday’s close (May 10).

The rebound so far this month following April’s correction has helped keep the winners winning. The top performer this year: commodities (GCC) via a 12.7% return. In second place: US stocks (VTI), posting a 9.2% year-to-date rise.

Tied for third and fourth place: equities in emerging markets (VWO) and developed markets ex-US (VEA) with 5.8% and 5.7% year-to-date returns, respectively.

Losses in 2024 remain concentrated in bonds and real estate securities. The deepest setback this year is in government bonds issued in developed markets ex-US (BWX) via a 5.6% decline.

Thanks to the robust gains in commodities and stocks, however, the overall trend for globally diversified portfolios is still comfortably positive this year, based on the Global Market Index (GMI). Beta risk, in other words, is providing a solid tailwind. GMI is an unmanaged benchmark (maintained by CapitalSpectator.com) holds all the major asset classes (except cash) in market-value weights and represents a competitive benchmark for multi-asset-class portfolios.

Profiling global markets based on drawdown, however, reminds that a relatively extreme degree of division prevails. While a handful of markets are close to previous peaks (foreign developed market stocks (VEA), US junk bonds (JNK) and US equities (VTI), most of the global markets are still posting relatively steep peak-to-trough declines. Indeed, the majority of current drawdowns for the major asset classes are below -10%.

Markets will be keenly focused on this week’s US consumer inflation report (Wed., May 15), which will likely set the tone for where risk assets go from here. Economists are looking for a dip in the year-over-year pace for headline and core CPI. If correct, it will mark renewed progress in taming inflation following stalled disinflation in April.

“The CPI report could go a long way towards really furthering the narrative that rate cuts are coming this year,” says Gennadiy Goldberg, head of U.S. rates strategy at TD Securities.

Book Bits: 11 May 2024

The Quiet Coup: Neoliberalism and the Looting of America
Mehrsa Baradaran
Summary via publisher (W.W. Norton)
With the nation lurching from one crisis to the next, many Americans believe that something fundamental has gone wrong. Why aren’t college graduates able to achieve financial security? Why is government completely inept in the face of natural disasters? And why do pundits tell us that the economy is strong even though the majority of Americans can barely make ends meet? In The Quiet Coup, Mehrsa Baradaran, one of our leading public intellectuals, argues that the system is in fact rigged toward the powerful, though it wasn’t the work of evil puppet masters behind the curtain. Rather, the rigging was carried out by hundreds of (mostly) law-abiding lawyers, judges, regulators, policy makers, and lobbyists. Adherents of a market-centered doctrine called neoliberalism, these individuals, over the course of decades, worked to transform the nation—and succeeded.

What Works, What Doesn’t (and When): Case Studies in Applied Behavioral Science
Dilip Soman, editor
Summary via publisher (U. of Toronto Press)
How well do behavioral science interventions translate and scale in the real world? Consider a practitioner who is looking to create behavior change through an intervention – perhaps it involves getting people to conserve energy, increase compliance with a medication regime, reduce misinformation, or improve tax collection. The behavioral science practitioner will typically draw inspiration from a previous study or intervention to translate into their own intervention. What Works, What Doesn’t (and When) presents a collection of studies in applied behavioral research with a behind-the-scenes look at how the project actually unfolded. Using seventeen case studies of such translation and scaling projects in diverse domains such as financial decisions, health, energy conservation, development, reducing absenteeism, diversity and inclusion, and reducing fare evasion, the book outlines the processes, the potential pitfalls, as well as some prescriptions on how to enhance the success of behavioral interventions. The cases show how behavioral science research is done – from getting inspiration to adapting research into context, designing tailored interventions, and comparing and reconciling results.

Catching Up to FTX: Lessons Learned in My Crusade Against Corruption, Fraud, and Bad Hair
Ben Armstrong
Summary via publisher (Wiley)
Celebrated YouTuber and podcaster Ben Armstrong delivers the extraordinary and compelling story of the rise and fall of FTX and its well-known founder Sam Bankman-Fried. Tracking the history of crypto exchanges from the original Mt. Gox to FTX and Binance, the author describes

Emerging Markets Corporates Are Upside Outlier For Global Bonds

Foreign fixed-income markets from a US investor perspective have been an unappealing asset class lately – with a glaring exception: corporate bonds in emerging markets. Year to date, this slice of global fixed-income securities is hot, based on a set of ETFs through Thursday’s close (May 9). The rest of the field is struggling.

High-yield bonds issued by companies in emerging markets are especially strong this year. VanEck Emerging Markets High Yield Bond ETF (HYEM) is posting a strong 5.1% rise so far in 2024. A distant second-place performer: WisdomTree Emerging Markets Corporate Bond Fund (EMCB), a (primarily) investment-grade holder of EM corporates that’s up 2.2%.

Otherwise, foreign bonds are in the red this year, led by a 5.2% loss for intermediate government bonds via developed markets ex-US (BWX). A US-dollar hedged global bonds ex-US benchmark (BNDX) is also underwater in 2024, echoing the loss for US bonds as well (BND).

“Emerging markets have done much better than anyone would have expected,” says David Hauner, head of global emerging markets fixed income strategy at Bank of America. “Clearly the credit component of EM sovereign bonds has held up well because the fundamentals have been improving.”

The rally in emerging markets bonds in 2024 is all the more impressive when you consider the headwind blowing from the US dollar, which has strengthened this year. An ETF proxy (UUP) for the US currency is higher by 5.9% year to date. All else equal, a firmer dollar translates into lower prices for foreign assets after converting into US dollar terms.

Learn To Use R For Portfolio Analysis
Quantitative Investment Portfolio Analytics In R:
An Introduction To R For Modeling Portfolio Risk and Return

By James Picerno

Accordingly, a strategy  of hedging out the US dollar exposure has juiced returns further for EM high yield. Meanwhile, the delay in expected rate cuts by the Federal Reserve has been a factor for why central banks in emerging markets have kept rates high. In turn, that’s been a plus for global investors seeking yield.

Indeed, emerging markets generally offer higher yields vs. the developed world. The trailing 12-month yield for VanEck Emerging Markets High Yield Bond ETF (HYEM) is 6.23%, according to Morningstar.com. By comparison, the equivalent for US bonds is roughly half.

Currency risk and higher volatility in emerging markets could reduce if not eliminate any premium in these countries’ fixed-income securities for US

US Labor Market Cycle Has Peaked. Will Recession Soon Follow?

There are many ways to monitor recession risk, but any one indicator in isolation is flawed. Context in the form of reviewing a wide variety of metrics is essential for minimizing noise. But in the search of early warning signs of trouble it’s useful to focus on the labor market, which is arguably the key driver of economic strength and weakness. Caution is still required, but a particular measure of the ebb and flow of payrolls is signaling a warning and so it’s worthwhile to take a closer look.

For a big-picture measure of how the labor market is faring in terms of the business cycle I favor the rolling 12-month change of the ratio of employment to unemployment, based on the household survey data published by the Labor Dept. According to this indicator, trouble is brewing.

Note that the one-year change has been negative since last summer. History suggests that when this metric falls below zero, the risk of an NBER-defined recession is elevated.

Using this indicator alone signals that a recession, if it hasn’t yet started, is imminent. The caveat is that no one indicator is flawless, especially in the post-pandemic era, during which several economic indicators have become distorted as business-cycle-analysis tools. Consider the US Treasury yield curve, which was once considered virtually infallible as a recession indicator. But it’s long-running inversion is now considered a false signal by many economists.

Will the labor market indicator in the chart above prove to be more reliable? Rather than trying to guess the correct answer, a better approach is to monitor a wide variety of metrics, which is the modeling focus in the weekly updates of the US Business Cycle Risk Report. Aggregating a wide variety of economic and financial indicators still reflects a growth bias. For example, the newsletter’s primary business cycle indicator – Composite Recession Probability Index (CRPI) – estimates low recession risk as of May 3.

That’s not a reason to dismiss the labor market indicator above – it could be a genuine warning that recession risk is rising. In fact, it’s one of the inputs into the modeling that informs the analysis for the US Business Cycle Risk Report.

But it’s prudent to avoid relying on any one indicator. If the labor market’s rollover via the first chart above is an accurate signal that a recession tipping point has been reached, it will

Will Housing Inflation Keep Interest Rates Higher For Longer?

Housing is among the most interest-rate sensitive sectors of the economy. It’s also one of the most cyclical and crucial inputs for the business cycle. On that basis, one could reasonably expect that the sharp runup in interest rates over the past two years would have crushed the trend in housing prices. For a while that was the effect, but the dramatic slide in the year-over-year change in US house prices is accelerating again. The reflation is moderate so far, at least compared with 2021-2022. But it’s notable that housing prices are once more looking resilient after the Federal Reserve’s most aggressive tightening policy in decades and before rate cuts have arrived.

Recent history tells the story. After the Fed began raising interest rates quickly in early 2022, the 30-year mortgage rate rose sharply, more than doubling by late-2022 vs. its year-earlier level. The strong year-over-year rise in housing prices at the time soon took a hit, falling from roughly a 20% annual increase in late-2022 to flatlining in 2023. But in recent months housing prices have revived, and are increasing more than 6% a year, based on S&P Core-Logic US National Home Price Index.

The revival in a firmer housing price trend is striking for several reasons. First, it arrives before the Fed has started cutting interest rates. In fact, market expectations for rate cuts have been pushed further into the future and so any relief for housing in the form of lower borrowing costs is on track to be delayed.

How is recession risk evolving? Monitor the outlook with a subscription to:
The US Business Cycle Risk Report

Meanwhile, the year-over-year change in housing is once again rising at a rate that’s faster than consumer inflation. That implies that housing is again a contributing factor to the sticky inflation problem the Fed is grappling with this year.

Another implication is that once the Fed starts cutting rates, which may start as early as September, according to Fed funds futures, policy easing could further strengthen the recent revival in housing inflation, which would contribute to the sticky inflation challenge.

The reflation in housing prices is also conspicuous because it’s again rising faster than year-over-year economic growth, based on nominal GDP. US output rose 5.4% in the first-quarter vs. the year-ago level – below the rate of growth for housing prices.

“The housing market is proving

Communications, Energy Are 2024’s Sector Leaders For US Stocks

The upside momentum in the US stock market so far this year continues to be led by rallies in communications services and energy shares, based on a set of ETFs through Monday’s close (May 6). Both sectors are outperforming the broad market and their counterparts.

Communication Services Select Sector SPDR Fund (XLC) and Energy Select Sector SPDR Fund (XLE) are tied for first place in 2024’s performance run. Each fund is posting a 12.2% year-to-date return. The gains reflect moderate premiums over the broad market’s 9.0% increase this year, based on SPDR S&P 500 ETF (SPY).

All but one of the primary equity sectors are sitting on year-to-gain gains — increases either match the broad market’s rally via SPY or fall short. The downside outlier for sector performance: real estate, which continues to post a steep year-to-date loss.

Property shares, which are prized for their relatively high payouts, have been hurt by the rise in Treasury yields. The stronger competition in risk-free government bonds is considered a factor in the slide for real estate investment trusts.

Real Estate Select Sector SPDR (XLRE), which has fallen 6.9% year to date, currently yields 3.69% on a trailing 12-month basis, according to Mornignstar.com. By comparison, the 10-year US Treasury yield is substantially higher at 4.49%, as of May 6.

For some analysts, the slide in property shares represents a buying opportunity, despite recent delays in expectations for rate cuts by the Federal Reserve. “From where listed REITs are currently priced, I don’t believe the market needs to expect rate cuts for REITs to deliver solid performance,” says Janus Henderson Investors’ Gregory Kuhl. “If the market reaches a solid consensus that rate hikes are off the table, that may be enough to get REITs going. It did seem like Powell took rate hikes off the table [at last week’s Fed meeting], which I think is a positive for REITs.”

Yield differentials may be a factor in REITs’ weak performance, but it’s notable that the utilities sector (XLU), which is also interest-rate sensitive, has rallied lately while XLRE has barely moved. XLU is up 9.5% year to date, a gap that suggests sentiment for property shares suffers from more than concerns about competitive Treasury yields.

Was April’s Correction Noise Or Signal For Global Markets?

April was a rough month for investors, but the rebound in asset prices in the early days of May has revived expectations that the worst has passed. A key catalyst for the turnaround in sentiment: Friday’s US payrolls data, which posted a substantially softer-than-expected rise in April. The crowd views the news as a net positive because it lifts the odds that the Federal Reserve will cut interest rates this year.

Even if this view is correct, which is open for debate, it’s not without risk for markets. Much depends on how fast and how far the US economy slows. A modest degree of cooling will probably help soften inflation, which has been firmer than expected in recent updates. But the deceleration in economic activity could come back to bite if the slowdown has substantial downside momentum.

How is recession risk evolving? Monitor the outlook with a subscription to:
The US Business Cycle Risk Report

“It feels a little early to declare that the US economy has made a soft landing since the Fed still is holding interest rates at restrictive levels,” says Comerica Bank chief economist Bill Adams. “But the April jobs report helps clear a path to that destination.”

For some analysts, however, the risk of the economy slowing more than the consensus assumes is significant. “The reason I think the Fed’s going to see enough to cut [interest rates] is because we’re more toward the hard landing end of the spectrum,” advises Citi chief US economist Andrew Hollenhorst.

One thing that is clear in the shift in rate-cut expectations: Fed funds futures this morning are pricing in moderately high odds for the first rate cut in September, a conspicuous shift from a week ago.

The bond market supports the latest dovish pivot: the policy-sensitive 2-year US Treasury yield starts the trading week at 4.83%, reflecting last week’s sharp drop that leaves this rate at its lowest level in nearly a month.

The caveat is that there are several moving parts for assuming a best-case scenario comprised of softer inflation and a mild slowdown in economic activity that trims inflation’s sails, reduces interest rates but without strengthening headwinds for earnings and the stock market. That’s a tall order, but one that’s suddenly back in vogue as a plausible path.

The week ahead will test the durability of this Goldilocks scenario, although the light schedule for