
Book Bits: 25 May 2024

● Shock Values: Prices and Inflation in American Democracy
Carola Binder
Interview with author via Marketplace.org
The word “inflation” is everywhere today, and it continues to shape how people feel about the economy. That’s the case despite the pace of inflation retreating from its high of June 2022, when prices were up nearly 9% from the year before, as measured by the consumer price index. Last month, prices were up only 3.4% on an annual basis. While it’s easy to think those feelings are unique, inflation has long been a top concern for Americans, going back to the founding of the country. One key thing that’s changed is how the government has intervened in the movement of prices… In her book, “Shock Values: Prices and Inflation in American Democracy,” Binder looks back at the long history of politics, inflation and how the government has tried to respond, at times through fiscal policy like price controls, at others with monetary policy.
● Plastic Capitalism: Banks, Credit Cards, and the End of Financial Control
Sean H. Vanatta
Summary via publisher (Yale U. Books)
American households are awash in expensive credit card debt. But where did all this debt come from? In this history of the rise of postwar American finance, Sean H. Vanatta shows how bankers created our credit card economy and, with it, the indebted nation we know today. America’s consumer debt machine was not inevitable. In the years after World War II, state and federal regulations ensured that many Americans enjoyed safe banks and inexpensive credit. Bankers, though, grew restless amid restrictive rules that made profits scarce. They experimented with new services and new technologies. They settled on credit cards, and in the 1960s mailed out reams of high-interest plastic to build a debt industry from scratch. In the 1960s and ’70s consumers fought back, using federal and state policy to make credit cards safer and more affordable. But bankers found ways to work around local rules. Beginning in 1980, Citibank and its peers relocated their card plans to South Dakota and Delaware, states with the weakest consumer regulations, creating “on-shore” financial havens and drawing consumers into an exploitative credit economy over which they had little control. We live in the world these bankers made.
● Money Capital: New Monetary Principles for a More Prosperous Society
Patrick Bolton and Haizhou Huang
Summary via publisher (Princeton U. Press)
A conventional economic theory, monetarism, holds that inflation is a monetary phenomenon
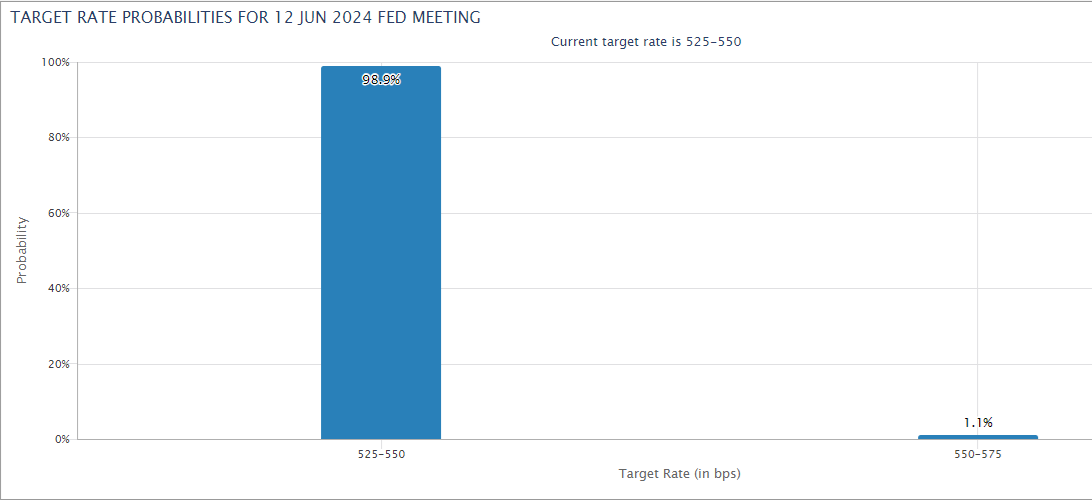
Fed Funds Futures Market Starts To Flirt With Rate Hike Possibility

The monetary policy outlook has been uncertain, but primarily in terms of the timing of the first rate cut. But that’s starting to change as Fed funds futures price in the possibility of a rate hike. To be clear, the implied probability for a hike is extremely low: no more than 1%. But the fact that market sentiment is pricing in any chance of a hike marks a shift.
It’s debatable if this shift is significant or just market noise. As for the central bank, Fed policymakers have communicated in recent months that rate hikes are unlikely while remaining cagey about the timing of rate cuts. Fed funds futures still don’t communicate any conflict with that outlook – the priced-in probabilities are still overwhelmingly skewing to no change or rate cuts for the next several FOMC meetings. For example, the market is estimating a roughly 50% probability for a rate cut at the Sep. 18 FOMC meeting, according to CME data. Meanwhile, confidence is high that the next Fed meeting (Jun. 12) will leave rates unchanged, although the slight possibility of a rate hike is peeking out with a 1.1% implied probability.
The policy-sensitive US 2-year Treasury yield is also pricing in a lower Fed funds target rate, which is currently 5.25% to 5.50%. By contrast, the 2-year yield yesterday (May 23) traded moderately lower at 4.91%. To be fair, the 2-year rate has been anticipating a rate cut for more than a year. In any case, this widely followed rate suggests the crowd is still erring on the side of rate cuts vs. hikes as the next policy change.
In recent days, however, economic data suggests the economy remains resilient, which suggests that it’s premature to dismiss the possibility of rate cut. Notably, PMI survey data for May indicates that the US economy rebounded sharply after April weakness. Meanwhile, jobless claims remain low, which implies that the labor market will continue to expand at a healthy pace in the near term.
The key variable is the path of inflation. The latest numbers show renewed signs of progress with disinflation, but the latest Fed minutes remind that while rate hikes are still a very low probability, the possibility is on the minds of policymakers, or so it appears if you read between the lines in the latest review of the May 30-Apr. 1 FOMC meeting:
Participants remained highly
Market Trends Continue To Lean Into A Bullish Signal

The old saw that markets climb a wall of worry is alive and kicking. Although there are plenty of warnings from analysts who see trouble ahead, trend profiles show no fear, via several pairs of ETF proxies for profiling the appetite for risk, based on prices through yesterday’s close (May 22).
What some see as a gravity-defying run higher extends similar profiles from earlier this year (see here and here). The party must end eventually, as all bull runs do, but for the moment the bias for risk-on remains conspicuous.
Learn To Use R For Portfolio Analysis
Quantitative Investment Portfolio Analytics In R:
An Introduction To R For Modeling Portfolio Risk and Return
By James Picerno
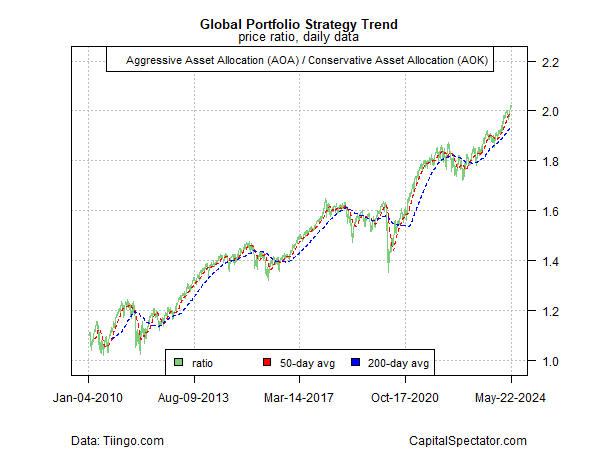
The net-positive bias still looks strong generally via an aggressive global asset allocation portfolio (AOA) vs. its conservative counterpart (AOK). At the start of the trading week this ratio touched a new record high before edging down on Tuesday and Wednesday.
The US equities market isn’t quite as hot as AOA:AOK, but its close, based on the ratio US stocks (SPY) vs. a low-volatility subset (USMV).
A key bellwether for stocks these days is the semiconductor industry (SMH), which is on track to rise for a fifth straight week. Relative to the broad market (SPY), this ratio looks set to reach a new peak soon.
A possible early warning sign that the bulls are becoming tired is the recent drop in housing stocks (XHB) relative US equities overall (SPY). This ratio has fallen in recent days, closing yesterday at the lowest level since February.
Meanwhile, the recent rally in medium-term US Treasuries (IEF) vs. shorter-term counterparts (SHY) is stalling again, suggesting that the long-running bear market in bonds has yet to run its course.
A potentially worrisome sign for the overall risk appetite is the rebound in inflation-indexed Treasuries (TIP) vs. conventional government bonds (IEF). The market appears to be flirting with a new run of reflation, but is still on the fence. This ratio remains well short of its previous peak in October. If and when TIP:IEF sets a new high, it would signal trouble for animal spirits.
US Economy Still On Track For Modest Pickup In Growth For Q2

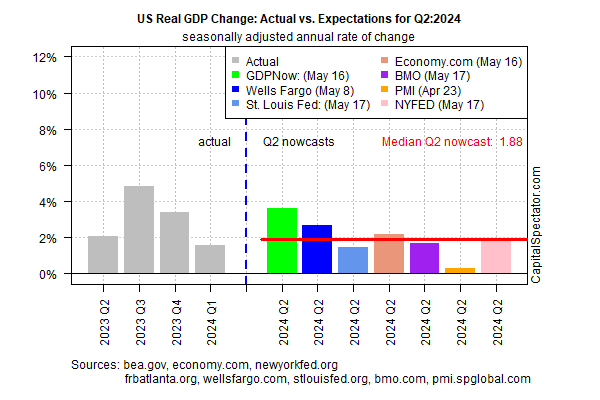
US economic activity is expected to post a modestly firmer increase in the second-quarter, based on the median estimate for a set of nowcasts compiled by CapitalSpectator.com. More than half of the quarter’s data sets have yet to be published, but the early clues continue to skew positive.
Output for the April-through-June period is projected to rise 1.9% (seasonally adjusted real annual rate), a modest pickup over Q1’s 1.6 advance. If the median Q2 nowcast is correct, the economy will post its first improvement over the previous quarter since the surge in output in 2023’s Q3.
With less than half of the quarter’s data set published there’s still a high degree of uncertainty about Q2’s outlook. But today’s update is encouraging in that the 1.9% nowcast for Q2 is essentially unchanged from the previous estimate (published on May 3).
Despite the relatively upbeat profile, there are several risk factors lurking, including negative sentiment. A new poll of Americans “wrongly believe the US is in an economic recession,” reports The Guardian.
How is recession risk evolving? Monitor the outlook with a subscription to:
The US Business Cycle Risk Report
Meanwhile, the US Consumer Sentiment Index weakened in May to its lowest reading in six months. “While consumers had been reserving judgment for the past few months, they now perceive negative developments on a number of dimensions,” reports Joanne Hsu, surveys of consumers director. “They expressed worries that inflation, unemployment and interest rates may all be moving in an unfavorable direction in the year ahead.”
It’s unclear how much of an impact that sentiment will have on the real economy, but it’s certainly a headwind in some degree. Nonetheless, today’s GDP nowcast suggests that the economy may be stabilizing if not firming up relative to Q1.
A possible early sign of trouble for later this year is the ongoing slowdown in labor market growth. Year-over-year private payrolls growth has ranged from 1.6% to 1.8% in recent months through April. A print below 1.6% in the upcoming May report would mark the slowest trend since the economy rebounded from the pandemic – a possible warning sign for the second half of 2024.
Meanwhile, retail sales growth has turned sluggish lately and so the May update will be widely watched.
For some economists, recession risk is already estimated as high for later this year. “Firms are hiring at a lower rate. Firms
Is The Yield Curve Still Relevant? An Economist Clarifies

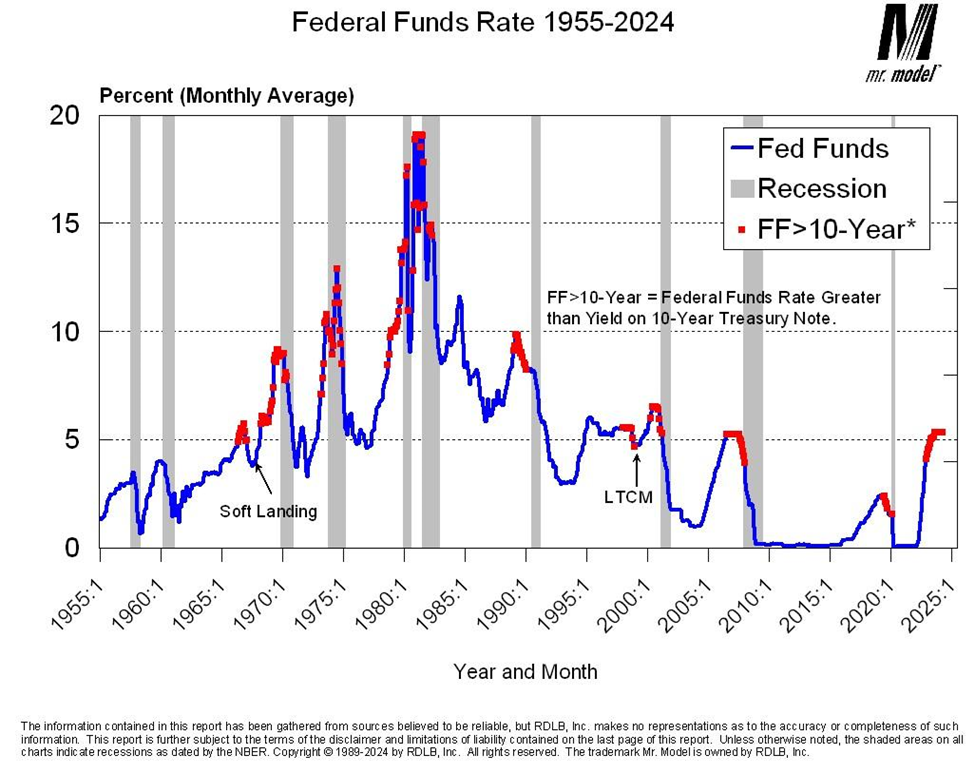
When the US Treasury yield curve inverts (short rates rise above long rates) the shift is widely viewed as a reliable forecast that a recession is near. But this time has been different, or so it seems. The curve has been inverted since July 2022, the longest inversion on record, but a recession has yet to arrive.
Is the yield curve no longer relevant for business-cycle analysis? Or is this widely-followed signal just slow this time? Actually, it’s neither, explains Robert Dieli, an economist at NoSpinForecast.com, a business-cycle consultancy.
In a series of email exchanges with CapitalSpectator.com, Dieli outlines his views on the yield curve, of which he is a veteran analyst on behalf of his clients. “The last four recessions started after the yield curve inversion was resolved,” he advises. “The signal is not when the curve inverts. The signal is when the curve goes back to its normal shape.”
In the following Q&A, Dieli shares additional thoughts (and charts) on the art/science of interpreting the yield curve for business-cycle analysis.
Q: What set of Treasury yield maturities do you prefer for monitoring the curve?
A: My criterion for whether we have an inverted yield curve is the yield on the 10-Year Treasury Note minus the current level of the Federal Funds Rate. In both cases I use the monthly average of each metric. I use the Fed Funds rate because the FOMC has complete control over its level and trend, which means that the duration and severity of a yield curve inversion are largely at their discretion. I use the 10-Year Note both because it has the longest continuous issuance history of the long-maturity securities (both the 20-Year and 30-Year Bonds have had gaps in issuance) and because it is currently the flagship rate in the bond market.
What is the track record for recession warnings for the yield curve when it normalizes after a period of inversion?
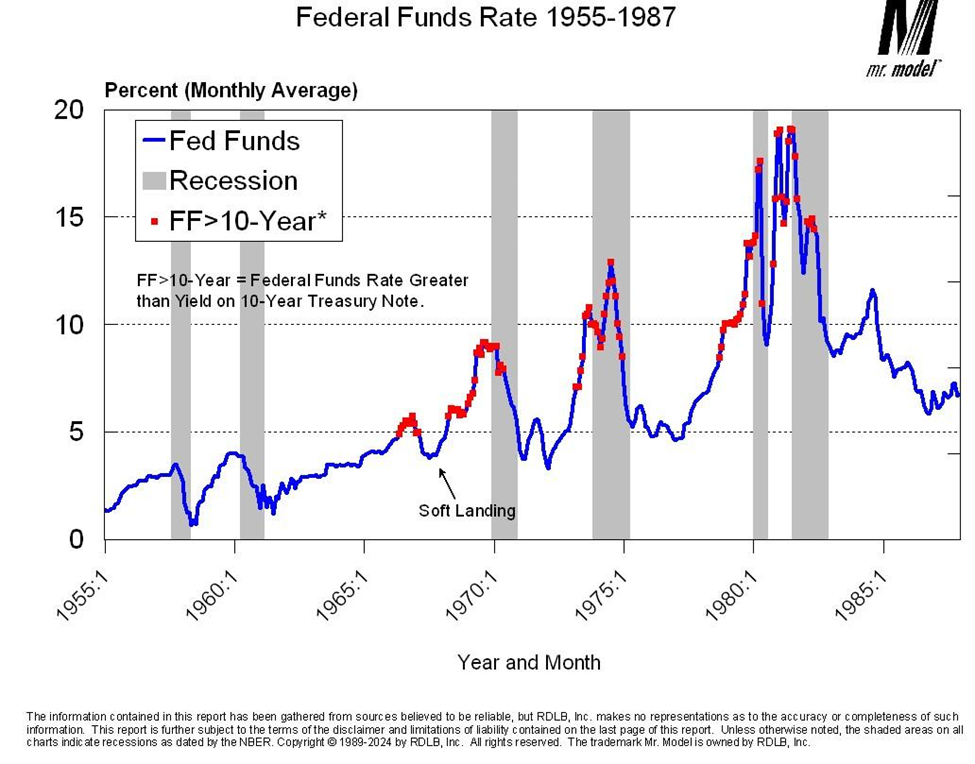
This chart shows the record of yield curve inversions going back to 1955. As you can see, we did not have inversions under my criterion, until the mid-1960s. The next two charts address the question you just posed.
During the period between 1955 and 1987 the curve inversions persisted into the recession periods. Note also that we had a period that I have marked as the “soft landing” where we had an inversion of the curve that was
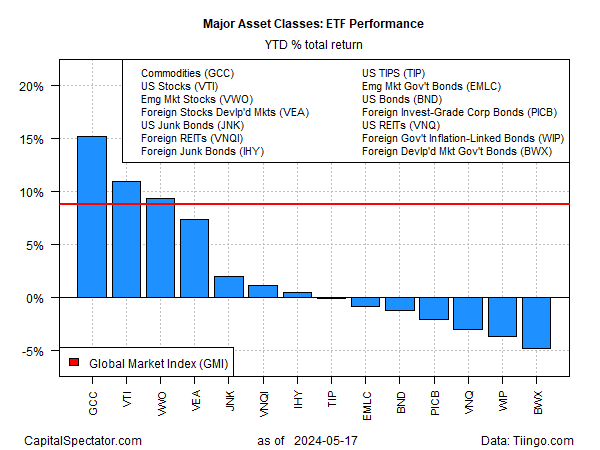
Commodities’ Performance Lead Widens Over Markets In 2024

Last week’s strong rally in commodities expanded the performance lead for the asset class over the rest of global markets, based on a set of ETFs through Friday’s close (May 17).
WisdomTree Enhanced Commodity Strategy Fund (GCC) is up 15.4% this year, more than four percentage points above the year-to-date rise for US stocks (VTI), the second-best performer for the major asset classes in 2024 via an 11.0% increase.
Several bullish trends have helped drive key commodities prices higher recently. For example, copper, a key component in renewable energy, hit a record high in early trading today. Gold also traded at a new peak today, as concerns about government debt and inflation animate buying in this corner. Meanwhile, crude oil, although it’s fallen sharply since April, has stabilized this month.
Meanwhile, Bloomberg last week reports: “Global grain supplies will be tighter in the coming season, setting the stage for higher prices for agricultural commodities as economies are still coping with stubborn inflation, according to a key US forecast.”
The big losers so far this year continue to be government bonds and US real estate investment trusts. The deepest year-to-date loss: sovereign bonds in developed markets ex-US (BWX) with a 4.8% decline in 2024.
The prospects of a rate cut by the Federal Reserve later this year has renewed hope that the worst is over for government fixed-income securities (bond prices and yields move inversely). Thanks to encouraging US inflation news last week, Fed funds futures are now pricing in moderately confident odds that the central bank will trim its target rate at the Sep. 18 FOMC meeting.
Book Bits: 18 May 2024

● A Map of the New Normal: How Inflation, War, and Sanctions Will Change Your World Forever
Jeff Rubin
Adapted essay from book via The Globe and Mail
The world is engulfed in an ever-escalating global trade war. Virtually every day, new sanctions are being imposed, triggering reciprocal actions against Western goods.
Where will this lead? Can the West still win such wars, as it has done before? If not, what are the consequences of losing?
Along with sanctions has risen a new world order in which the United States and its NATO allies can no longer use their economic and military power to unilaterally dictate terms to the rest of the world.
● Everything Is Predictable: How Bayesian Statistics Explain Our World
Tom Chivers
Review via The Wall Street Journal
First articulated in the 18th century by a hobbyist-mathematician seeking to reason backward from effects to cause, Bayes’ theorem spent the better part of two centuries struggling for recognition and respect. Yet today, argues Tom Chivers in “Everything Is Predictable,” it can be seen as “perhaps the most important single equation in history.” It drives the logic of spam filters, artificial intelligence and possibly our own brains. It may soon help us work through tricky social problems like vaccine hesitancy. Once you start to look for it, Mr. Chivers says, you start to see Bayes’ theorem everywhere.
At its core, the theorem provides a quantitative method for getting incrementally wiser by continuously updating what you think you know—your prior beliefs, which initially might be subjective—with new information. Your refined belief becomes the new prior, and the process repeats.
● The War on Prices: How Popular Misconceptions about Inflation, Prices, and Value Create Bad Policy
Ryan A. Bourne
Review via Reason.com
Prices are guardians of scarce resources, ensuring that these are allocated to their most valuable uses. Prosperity results from the encouragement given to the production of goods and services that people desire most.
There is someone else who sees the price system for its beauty and would like to protect it from continued government interferences: the Cato Institute’s Ryan Bourne. He has an excellent new book, The War on Prices: How Popular Misconceptions about Inflation, Prices, and Value Create Bad Policy. It includes 24 essays written by some of the best economists in the business, each addressing a different aspect of today’s war on prices—the widespread and counterproductive ways governments are trying to control inflation or particular prices.
Research Review | 17 May 2024 | Market Analytics
Regime-Based Strategic Asset Allocation
Eric Bouyé and Jerome Teiletche (World Bank)
April 2024
What should investors do in the presence of economic regimes? Researchers and practitioners usually address this topic from a tactical asset allocation point of view. In this article, we depart from the literature by tackling the issue strategically and analytically. Modeling economic regimes as a mixture of distributions, we first investigate what happens to moments of the distribution of returns. We next deduct the implications for portfolios built under popular asset allocation methodologies (mean-variance-optimization, risk budgeting). Using these analytical results, we define new portfolio construction methodologies seeking to exploit the information in macroeconomic (macro) regimes through the composition of optimal portfolios for each regime, the risk structure of these portfolios, and the long-term probability of the regimes. We empirically show that macro regime-based portfolios can outperform traditional asset-based portfolios, for both multi-asset and equity factor universes, over a sample of more than fifty years.
Do Oil Price Shocks Drive Risk Premia in Stock Markets? A Novel Investment Application
Riza Demirer (Southern Illinois University Edwardsville), et al.
March 2024
Motivated by the evidence from the investment-based theories in the asset pricing literature that links asset pricing factors to economic shocks, this paper examines the effect of disentangled oil price shocks on factor returns in a large set of 62 stock markets. Our findings show that oil market shocks capture significant predictive information regarding the size and direction of factor returns in global stock markets although we observe a great deal of heterogeneity in the response of factors to these shocks, depending on the market classification and the type of oil shock. We show that oil supply and precautionary demand shocks possess the greatest predictive power over systematic risk premia, particularly for value and momentum. We argue that time varying investor sentiment and the flexibility of firms to respond to economic shocks drive the responses of factors to oil market shocks. Further examining the economic implications of the predictive patterns observed, we show that a conditional global factor investing strategy wherein the investment positions are tilted towards factor-based portfolios conditional on the size and direction of the oil price shock yields significant improvements in portfolio returns and diversification over the passive investment strategy. Our findings show that the performance of smart beta strategies can be significantly improved by conditioning factor positions based on the size and direction of shocks.
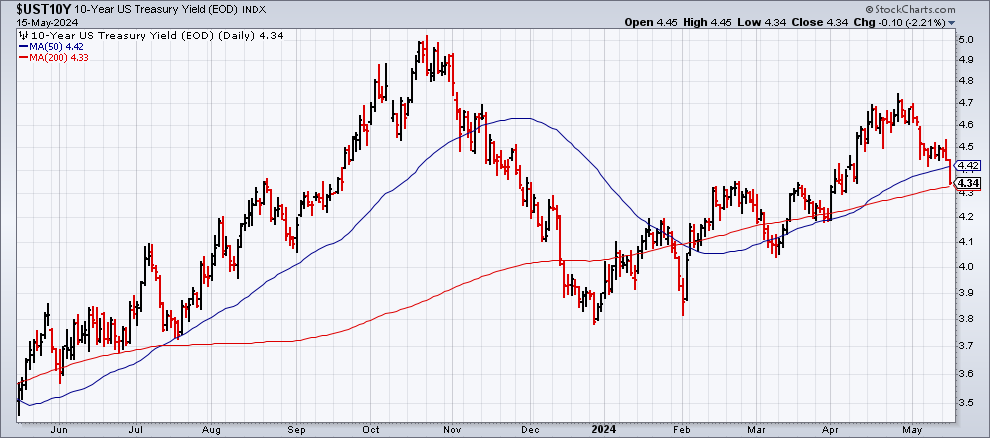
10-Year US Treasury Yield ‘Fair Value’ Estimate: 16 May 2024

A ‘fair-value’ estimate of the US 10-year Treasury yield was steady in April while the market level for the benchmark rate continued to rise well above the theoretical level. But trading activity this month suggests the trend may be shifting. Yesterday’s sharp fall in the 10-year yield (May 15) substantially narrowed the spread, which implies that the market’s premium over fair value had become extreme.
Following yesterday’s upbeat US consumer inflation news for April, the 10-year yield fell on Wednesday to a six-week low of 4.34%. The slide marks a hefty reversal after this rate climbed to 4.71% at one point in April.
Recall that CapitalSpectator.com’s fair-value estimates for the 10-year yield in recent months have been well below the market rate. As discussed over the past year or so (last month, for example), our modeling suggested that the crowd was pricing in a premium for the 10-year yield that appeared excessive, based on the average estimate for three models (defined here). As a result, the market level looked unsustainable without a dramatic change in the macro fundamentals, such as a sharp rise in inflation. In fact, disinflation, although it stalled recently, persists.
The current fair-value estimate for April is 4.21%, fractionally below the previous month’s level. Based on last month’s data, the market rate rose to a 1.33 percentage-point premium over the average fair-value yield – close to the highest margin since the early 1990s.
How is recession risk evolving? Monitor the outlook with a subscription to:
The US Business Cycle Risk Report
In other words, the market premium baked into the 10-year yield remained lofty last month. Although such extremes aren’t unprecedented, they tend to be relatively short-lived, or so history suggests. As the next chart below reminds, premiums tend to reverse… eventually.
The timing of normalization, as always, is unclear. It’s also worth pointing out that this time could be different, i.e., the market, for whatever reason, maintains a relatively large yield premium for longer than expected. But yesterday’s sharp decline in the market rate for the 10-year yield implies that the premium has started to fade and the history will, in time, repeat.
The thesis on these pages has long been that while the market can maintain a relatively large yield premium for an extended period, the much-lower fair-value estimate will likely restrain the crowd from bidding up the 10-year rate beyond