US Stocks Are (Still) Leading The Major Asset Classes In 2024

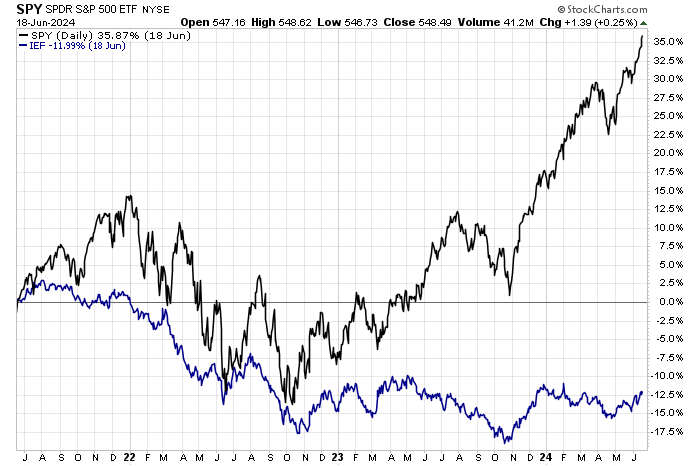
There was a brief period earlier this year when US shares gave up the leadership crown to commodities, but American stocks have retaken the performance throne in June, based on a set of ETFs through Friday’s close (June 21).

Vanguard Total US Stock Market ETF (VTI) closed last week with a strong 13.5% year-to-date gain. In close pursuit in the number-two slot: commodities (GCC), which had been leading in 2024 back in April and early May.

Stocks ex-US are well behind their US counterparts, but respectable gains in offshore shares are still conspicuous this year. Equities in emerging markets (VWO) have rebounded and are currently posting a third-place win in 2024 of 7.5%. Shares in developed markets ex-US (VEA) are in fourth place with a 4.0% year-to-date increase.

US bonds have recovered over the past two months but have yet to post a meaningful year-to-date gain. Vanguard Total Bond Market (BND) is essentially flat in 2024.

There are plenty of losers elsewhere in global markets, including property shares and foreign bonds. The biggest decline is currently found in developed-market government bonds ex-US (BWX), which is in the hole by 6.2%.

Notably, a forecast-free, passive measure of holding all the world’s markets in market-value weights continues to generate solid results this year. This unmanaged benchmark holds all the major asset classes (except cash) in market-value weights via ETFs and represents a competitive measure for multi-asset-class-portfolio strategies. GMI is currently up 9.7% in 2024, outperforming all its components except two: US stocks and commodities.

Book Bits: 22 June 2024

What Went Wrong with Capitalism
Ruchir Sharma
Essay by author via Financial Times
Many observers think the era of easy money ended with the recent return of inflation, because it forced central banks to raise interest rates. But this era was not defined only by low rates and did not begin only in 2008; it encompasses the suite of habits — borrow, bail out, regulate, stimulate — that have been building for a century. It is not over until old habits change.

How the World Ran Out of Everything: Inside the Global Supply Chain
Peter S. Goodman
Review via The Wall Street Journal
In “How the World Ran Out of Everything,” a colorful and very readable look at how the Covid-19 pandemic wreaked havoc with supply chains, Peter S. Goodman makes clear that he doesn’t think much of outsourcing, offshoring and just-in-time manufacturing. He contends that the late deliveries and barren retail shelves of 2021 and 2022 were the consequence of a yearslong effort to cut costs and boost profits by shifting production overseas. “The executives of publicly traded corporations and their hired enablers in the political sphere have played make-believe with the world economy,” he writes. As he describes the situation, the past few decades of globalization, at least insofar as manufacturing is concerned, were pretty much a mistake.

The Trolls of Wall Street: How the Outcasts and Insurgents Are Hacking the Markets
Nathaniel Popper
Review via Financial Times
“Meme stock” mania peaked in 2021, when amateur traders, geeing each other up online, jacked up the price of stocks like GameStop and AMC. In his readable, propulsive history of WallStreetBets — the Reddit forum at the heart of the stock-trading craze — Nathaniel Popper argues that the effects of that mania are still being felt.
Popper recounts the history of the forum — founded in 2012 — in detail. His excellent access to chat logs and historical Reddit comments give an inside perspective on the long rise preceding the forum’s mainstream notoriety. Nonetheless, the book hits its straps in the chapters devoted to trading in GameStop shares, whose whiplash price moves dented hedge funds, kinked financial plumbing and made amateur trading front-page news.

Money and Promises: Seven Deals That Changed the World
Paolo Zannoni
Review via Publishers Weekly
Zannoni, the executive vice-chairman of Prada’s board of directors, debuts with an edifying examination of how debt has shaped banking throughout history. Arguing that “the true nature of modern money…

What Does The Bank of England’s Delayed Rate Cut Imply For US?

If the Bank of England’s decision on Thursday to leave interest rates unchanged is a guide, the outlook for the start date for a US rate cut may be further down the line than generally assumed.

There are many differences between the UK and US economy and so sizing up BoE policy decisions with the Federal Reserve is an apples and oranges comparison on several fronts. Yet it’s hard to overlook the fact that the Old Lady of Threadneedle Street left its target rate unchanged, at 5.25% on Thursday (June 20), despite a return of UK inflation to the central bank’s 2% target in May, reported the day before.

It’s also striking that UK inflation is well below the equivalent for the US. Naively extrapolating the difference as a guide to the future suggests that the Fed’s rate cut is nowhere on the near-term horizon – a guesstimate that contrasts with market expectations in the US.

But England isn’t America and the crowd evaluates the macro outlook quite differently for the US, and rightly so. Nonetheless, there’s still room for debate on guesstimates on timing for the first Fed rate cut. Fed funds futures are currently estimating an implied 66% probability that the Sep. 18 FOMC meeting will mark the first announcement of policy easing. The obvious caveat: US investors have been pricing in moderate odds for rate cuts for much of the past year, only to be disabused of that forecast, time and time again.

Is this time different? No one knows, but the BoE’s decision surely offers another reason to stay cautious on expecting US rate cuts will arrive sooner rather than later. Indeed, despite a clear sign that UK inflation has returned to target, the central bank remains reluctant to embrace a dovish pivot.

“It’s good news that inflation has returned to our 2 per cent target,” notes Andrew Bailey, BoE’s governor. “We need to be sure that inflation will stay low and that’s why we’ve decided to hold rates at 5.25 per cent for now.”

Learn To Use R For Portfolio Analysis
Quantitative Investment Portfolio Analytics In R:
An Introduction To R For Modeling Portfolio Risk and Return

By James Picerno

The key question: Will the Fed be similarly cautious? At least one voting member of the FOMC is leaning in that direction. Thomas Barkin, president of the Federal Reserve Bank of Richmond, told

The Case For Portfolio Rebalancing Looks Compelling

By nearly any measure you cite, US equities are enjoying a stellar run. Despite numerous global risks, investor sentiment for American shares is resilient. The question, as always, is when is it timely to take some of the winnings and redeploy to other assets classes?

There are countless ways to engage in opportunistic portfolio rebalancing analytics, but a good way to start is by profiling performance. For US equities, the case for tamping down expectations looks persuasive. To the extent that expected return evolves inversely with trailing performance, recent history provides a baseline for thinking about risk.

Meanwhile, the view that the bear-market for bonds is over is attracting more attention. The future’s uncertain as always, of course, but one can argue that the foundation is in place for a round of portfolio rebalancing.

Consider how US stocks and Treasuries compare over the past three years, based on a set of ETFs: SPY for equities and IEF for government bonds. The divergence is a chasm.

As I wrote earlier this week, a multi-factor measure of the directional bias for Treasury yields suggests that the worst for the bear market in bonds has passed (see chart below). Other analysts are coming to the same conclusion. We’ve seen the peak in yields,” says Stephen Miller, an investment strategist at GSFM in Sydney. “Bonds are now back as having a deserved place in a multi-asset portfolio.”

US Treasuries (IEF) are starting to show an upside bias lately. Although it’s still early for the rebound narrative, it’s plausible that we’re in the early stages of an extended rebound. If so, the odds are beginning to tip in favor of a bullish view for bonds.

Meanwhile, US stocks appear overextended. Let’s start with a rolling one-year-return profile for the S&P 500 Index. The 24% rise over the past year (through June 18) has yet to reach the extreme peaks in history, but it’s clearly at a lofty level that’s rarely experienced.

For a clearer view of how the S&P’s current one-year change compares with decades past, the next chart reminds that a 24% increase is well above the inter-quartile range that (gray box) that marks the lion’s share of the return distribution for the past 60 years-plus.

Taking a longer-term view, it’s also clear that the trailing 10-year return for the S&P 500 is also elevated. The 10.9% annualized gain for

Is US Recession Risk Rising? Warning Signs Are Starting To Emerge

Recession talk for the US is on the march again. Although there’s still room for debate on the near-term business-cycle outlook, some indicators are highlighting decelerating growth that could be the start of trouble in the second half of the year into early 2025.

To be fair, there’s plenty of real-time pushback that suggests the economic expansion will roll on. But a set of multi-factor indexes featured in the weekly updates of The US Business Cycle Risk Report show a marked deterioration in the macro trend.

The Economic Trend Index (ETI) and Economic Momentum Index (EMI) continue to roll over after more than a year of recovery. Both benchmarks remain above the respective tipping points that mark recessionary conditions, based on data through May, but it’s clear that these indicators have peaked. Meanwhile, forward estimates suggest that the deterioration will continue.

Using an econometric technique that estimates data for each of the 14 underlying components of ETI and EMI suggests that both indexes will drop to just above their tipping points in July. The implication: recessionary conditions could start as early as August, although looking that far ahead is still mostly guesswork. (March is currently the last full month of published data for calculating ETI and EMI, with progressively higher degrees of missing numbers going forward.)

Using another methodology to nowcast US recession risk paints a brighter profile, which serves as a reminder that the path ahead for the US economy is not yet written in stone. The Composite Recession Probability Index (CRPI) is currently estimating a low 5% probability that the US is in an NBER-defined recession or will imminently fall into one. But the recent uptick in CRPI may be an early sign of things to come. A rise above 10% in the days and weeks ahead, in concert with the recent weakness in ETI and EMI, would be a worrisome sign for the second half of 2024. (CRPI aggregates several business cycle indexes, including ETI and EMI, along with benchmarks published by other sources, including two regional Fed banks.)

For now, economists are debating if recession risk can be avoided. By some accounts, cutting interest rates would lower the threat, but the clock is ticking, advises Claudia Sahm, chief economist at New Century Advisors. “My baseline is not recession,” she says. “But it’s a real risk, and I do not understand why the Fed

10-Year US Treasury Yield ‘Fair Value’ Estimate: 18 June 2024

The US 10-year Treasury yield continues to defy The Capital Spectator’s ‘fair-value’ estimate by trading at a premium to this model, but the relatively wide gap still appears to be a constraint to the upside for this key market rate.

As discussed in recent months, it’s the view on these pages that without a material upside change in the fair value estimate, the 10-year yield will likely face headwinds to rising further. Recent market activity for the 10-year rate is starting to fall in line with this view.

Consider that the 10-year yield has been trending down for much of the past two months, closing at 4.29% on Monday (June 17) – near the lowest level since late-March.

Earlier this year the market premium for the 10-year yield increased to an unusually high but not unprecedented level. That’s been a sign that the degree of market premium is near a peak–a forecast that’s starting to resonate via market data.

Learn To Use R For Portfolio Analysis
Quantitative Investment Portfolio Analytics In R:
An Introduction To R For Modeling Portfolio Risk and Return

By James Picerno

For some perspective, start with the history of the average fair-value estimate (based on three models) vs. the market yield. Using monthly data, the current average fair-value estimate is 3.34% for May, the first dip this year. Meanwhile, the market yield remains more than 100 basis points higher at 4.48% as of last month, although here too the market rate ticked lower for the first time in 2024.

For a clearer view of the relationship, the next chart tracks the market rate less the average fair-value estimate. This spread has fallen modestly from its recent peak. If history is a guide, the market premium will ease further in the months ahead.

A lesser spread implies the market rate will fall, the average model estimate will rise, or some combination of both. Short of a relatively dramatic run of reflation in the US economy and/or a strong acceleration in economic growth relative to recent history (neither of which looks likely at this point), the path ahead seems to favor a lower spread.

Most US Equity Sectors Are Up This Year—With Two Exceptions

The US stock market’s strong year-to-date gain so far in 2024 has enjoyed wide support among equity sectors. The two glaring downside exceptions: consumer discretionary and real estate shares, based on a set of ETFs through Monday’s close (June 10).

On the upside, the communications services sector (XLC) is the clear leader. Indeed, this fund, which holds the likes of Meta, Alphabet and Netflix, has soared 16.8% so far this year. Not only is that a strong performance in absolute terms, it’s also beating the broad market (SPY), which is up 13.1%. In fact, XLC is the only sector that’s ahead of stocks overall in 2024.

The loser’s circle this year is limited to consumer discretionary shares (XLY), which is posting a fractional loss, and real estate stocks (XLRE), which are in the red by 4.1%.

XLRE holds commercial real estate investment trusts (REITs), which have struggled since the Federal Reserve started raising interest rates in early 2022. REITs are prized for their relatively high dividend payouts, but competition from risk-free Treasuries has been a tough(er) act to beat lately.

Contrarians argue that REITs are an intriguing value play. XLRE’s 3.51% trailing 12-month yield, according to Morningstar.com, is a factor. That’s nearly 80% of the current 10-year Treasury yield. Add in the potential for capital appreciation in REITs (if you’re so inclined), after a bruising couple of years, and the outlook looks relatively attractive, some analysts argue.

Maybe, but the technical profile for XLRE still leaves room for doubt. The ETF has rallied off its late-2023 low, but the price trend still looks weak. The outlook, from a technical perspective, would look brighter if XLRE can move above its recent peak of ~40. That breakout may be brewing in the near term, but at the moment optimism is limited to expecting a trading range.

On the bright side, XLRE has tested its downside support of roughly 32 and, so far, it’s held. That’s a sign that the worst may have passed for REITs. A rate cut by the Fed would help, but that’s still not on the immediate horizon, according to Fed funds futures.

How is recession risk evolving? Monitor the outlook with a subscription to:
The US Business Cycle Risk Report

Resilient US Labor Market Blurs Outlook For Rate Cuts

Ahead of Friday’s payrolls data for May the crowd was newly confident, again, that the Fed would soon start cutting interest rates. Treasury yields were sliding and expectations were rising that policy easing was near. But the May jobs report flipped the script with news of stronger-than-expected hiring.

Nonfarm payrolls rose 272,000 in May, rebounding sharply from April’s gain with a gain that was well above the consensus forecast. The week-long drop in Treasury yields reversed and the game of forecasting the Fed’s next move was once more back in play.

The news certainly complicates the outlook for this week’s Federal Reserve policy announcement on Wednesday, June 12. Although the market has long expected no change in policy for this meeting, the payrolls data has refocused attention on the central bank’s revised economic projections that will be released on Wednesday. Meanwhile, Fed Chairman Jerome Powell’s press conference will take on new import as markets digest the latest sign of labor market resilience.

The Fed funds futures market this morning is pricing in modest odds that the first rate cut will now arrive at the November 7 FOMC meeting. A September rate cut, which was considered moderately likely before Friday’s jobs data, is now estimated as a coin flip.

The policy-sensitive 2-year Treasury yield continues to trade well below the current Fed funds rate, but the market in recent weeks has pared the spread. In other words, this key Treasury yield is also pricing in lower odds that a rate cut is near relative to recent history.

A simple model for estimating the current state of monetary policy suggests that a moderately hawkish bias still prevails. The implication: policy is still putting downside pressure on inflation.

The joker in the deck is Wednesday’s consumer price data for May, which will be published several hours ahead of the Fed’s announcement that day. Economists are expecting inflation’s pace will remain comparable to April’s rise. Sticky inflation, in sum, is still the crowd’s outlook. That leaves the burning question: How will the Fed react?

Book Bits: 8 June 2024

The Last Human Job: The Work of Connecting in a Disconnected World
Allison Pugh
Summary via publisher (Princeton U. Press)
With the rapid development of artificial intelligence and labor-saving technologies like self-checkouts and automated factories, the future of work has never been more uncertain, and even jobs requiring high levels of human interaction are no longer safe. The Last Human Job explores the human connections that underlie our work, arguing that what people do for each other in these settings is valuable and worth preserving.

How to Make Money: An Ancient Guide to Wealth Management
Translated by Luca Grillo
Summary via publisher (Princeton U. Press)
Ancient Romans liked money. But how did they make a living and sometimes even become rich? The Roman economy was dominated by agriculture, but it was surprisingly modern in many ways: the Romans had companies with CEOs, shareholders, and detailed contracts regulated by meticulous laws; systems of banking and taxation; and a wide range of occupations, from merchant and doctor to architect and teacher. The Romans also enjoyed a relatively open society, where some could start from the bottom, work, invest, and grow rich. How to Make Money gathers a wide variety of ancient writings that show how Romans thought about, made, invested, spent, lost, and gave away money.

Cuckooland: Where the Rich Own the Truth
Tom Burgis
Review via Financial Times
“I will prove to you . . . that everything you’ve written is ninety-five per cent bullshit, lies and bias,” the Tory donor, businessman and self-styled “thought leader” Mohamed Amersi tells journalist Tom Burgis halfway through this savagely funny new book. “I hope your publishers are going to view this tape recording, so they know before they publish shit what it is.”
Evidently HarperCollins took a different view: Amersi’s obscenity-laden threats against Burgis sparkle through the buoyant prose of Cuckooland. The book charts Amersi’s colourful career and tells a wider tale of how corruption and influence-peddling works in the modern world, and how, in the age of social media manipulation and expensive lawsuits, “the rich can buy everything — including the truth”.

The Truth About Immigration: Why Successful Societies Welcome Newcomers
Zeke Hernandez
Interview with author via Marketplace.org
Q: When it comes to the economics of immigration, there is the big one: immigration and its effect on wages and jobs. So let’s start there. Does immigration reduce wages?
A: The short answer is no. I understand that that’s a big question, but we have enough evidence to know