Triton exits pharmaceutical packaging producer Bormioli Pharma Group

Funds advised by European mid-market private equity firm Triton have agreed to sell BlitzLuxCo, the holding company of pharmaceutical packaging producer Bormioli Pharma Group, to Gerresheimer, a systems and solutions provider for the pharma, biotech and cosmetics industries. 

The transaction is expected to close in Q4 2024. 

Triton acquired Bormioli in 2017 via a corporate carveout. In a press statement, the firm said that it had helped improve Bormioli’s management team, organisational and operational structure, as well as expand the company’s manufacturing base and oversee four acquisitions. 

Andrea Lodetti, CEO of Bormioli Pharma Group, added that the company had been “able to build out our positions across pharma packaging, with one-stop-shop capabilities in terms of technology as well as product offering” during Triton’s ownership. 

BNP Paribas and Goldman Sachs International acted as M&A financial advisors. 

How likely is a BHP-Anglo merger now?

Standard DigitalWeekend Print + Standard Digital

wasnow $75 per month

Complete digital access to quality FT journalism with expert analysis from industry leaders. Pay a year upfront and save 20%.

What’s included

Global news & analysisExpert opinionFT App on Android & iOSFT Edit appFirstFT: the day’s biggest stories20+ curated newslettersFollow topics & set alerts with myFTFT Videos & Podcasts20 monthly gift articles to shareLex: FT’s flagship investment column15+ Premium newsletters by leading expertsFT Digital Edition: our digitised print editionWeekday Print EditionFT WeekendFT Digital EditionGlobal news & analysisExpert opinionSpecial featuresExclusive FT analysisFT Digital EditionGlobal news & analysisExpert opinionSpecial featuresExclusive FT analysisGlobal news & analysisExpert opinionFT App on Android & iOSFT Edit appFirstFT: the day’s biggest stories20+ curated newslettersFollow topics & set alerts with myFTFT Videos & Podcasts10 monthly gift articles to shareGlobal news & analysisExpert opinionFT App on Android & iOSFT Edit appFirstFT: the day’s biggest stories20+ curated newslettersFollow topics & set alerts with myFTFT Videos & Podcasts20 monthly gift articles to shareLex: FT’s flagship investment column15+ Premium newsletters by leading expertsFT Digital Edition: our digitised print editionEverything in PrintWeekday Print EditionFT WeekendFT Digital EditionGlobal news & analysisExpert opinionSpecial featuresExclusive FT analysisPlusEverything in Premium DigitalEverything in Standard DigitalGlobal news & analysisExpert opinionSpecial featuresFirstFT newsletterVideos & PodcastsFT App on Android & iOSFT Edit app10 gift articles per monthExclusive FT analysisPremium newslettersFT Digital Edition10 additional gift articles per monthMake and share highlightsFT WorkspaceMarkets data widgetSubscription ManagerWorkflow integrationsOccasional readers go freeVolume discountFT Weekend Print deliveryPlusEverything in Standard DigitalFT Weekend Print deliveryPlusEverything in Premium Digital

Stocks making the biggest moves midday: Nvidia, Boeing, Live Nation Entertainment and more

What History Reveals About Interest Rate Cuts

Published

1 hour ago

on

May 23, 2024 Graphics & Design What History Reveals About Interest Rate Cuts

The Federal Reserve has overseen seven cycles of interest rate cuts, averaging 26 months and 6.35 percentage points (ppts) each.

We’ve partnered with New York Life Investments to examine the impact of interest rate cut cycles on the economy and on the performance of financial assets in the U.S. to help keep investors informed. 

A Brief History of Interest Rate Cuts

Interest rates are a powerful tool that the central bank can use to spur economic activity. 

Typically, when the economy experiences a slowdown or a recession, the Federal Reserve will respond by cutting interest rates. As a result, each of the previous seven rate cut cycles—shown in the table below—occurred during or around U.S. recessions, according to data from the Federal Reserve. 

Interest Rate Cut CycleMagnitude (ppts) July 2019–April 2020-2.4 July 2007–December 2008-5.1 November 2000–July 2003-5.5 May 1989–December 1992-6.9 August 1984–October 1986-5.8 July 1981–February 1983-10.5 July 1974–January 1977-8.3 Average-6.4

Understanding past economic and financial impacts of interest rate cuts can help investors prepare for future monetary policy changes.

The Economic Response: Inflation

During past cycles, data from the Federal Reserve, shows that, on average, the inflation rate continued to decline throughout (-3.4 percentage points), largely due to the lagged effects of a slower economy that normally precedes interest rate declines. 

CycleStart to end change (ppts)End to one year later (ppts) July 2019–April 2020-1.5+3.8 July 2007–December 2008-2.3+2.6 November 2000–July 2003-1.3+0.9 May 1989–December 1992-2.5-0.2 August 1984–October 1986-2.8+3.1 July 1981–February 1983-7.3+1.1 July 1974–January 1977-6.3+1.6 Average-3.4+1.9

However, inflation played catch-up and rose by +1.9 percentage points one year after the final rate cut. With lower interest rates, consumers were incentivized to spend more and save less, which led to an uptick in the price of goods and services in six of the past seven cycles. 

The Economic Response: Real Consumer Spending Growth

Real consumer spending growth, as measured by the Bureau of Economic Analysis, typically reacted to rate

Fossil fuels could have been left in the dust 25 years ago

Gordon Moore’s famous prediction about computing power must count as one of the most astonishingly accurate forecasts in history. But it may also have been badly misunderstood — in a way that now looks like a near-catastrophic missed opportunity. If we had grasped the details behind Moore’s Law in the 1980s, we could be living with an abundance of clean energy by now. We fumbled it.

A refresher on Moore’s Law: in 1965, electronics engineer Gordon Moore published an article noting that the number of components that could efficiently be put on an integrated circuit was roughly doubling every year. “Over the short term this rate can be expected to continue, if not increase,” he wrote. “There is no reason to believe it will not remain nearly constant for at least 10 years. That means, by 1975, the number of components per integrated circuit for minimum cost will be 65,000.”

That component number is now well into the billions. Moore adjusted his prediction in 1975 to doubling every two years, and the revised law has remained broadly true ever since, not only for the density of computer components but for the cost, speed and power consumption of computation itself. The question is, why?

The way Moore formulated the law, it was just something that happened: the sun rises and sets, the leaves that are green turn to brown, and computers get faster and cheaper.

But there’s another way to describe technological progress, and it might be better if we talked less about Moore’s Law, and more about Wright’s Law. Theodore Wright was an aeronautical engineer who, in the 1930s, published a Moore-like observation about aeroplanes: they were getting cheaper in a predictable way. Wright found that the second of any particular model of aeroplane would be 20 per cent cheaper to make than the first, the fourth would be 20 per cent cheaper than the second, and every time cumulative production doubled, the cost of making an additional unit would drop by a further 20 per cent.

A key difference is that Moore’s Law is a function of time, but Wright’s Law is a function of activity: the more you make, the cheaper it gets. What’s more, Wright’s Law applies to a huge range of technologies: what varies is the 20 per cent figure. Some technologies resist cost improvements. Others, such as solar photovoltaic modules,

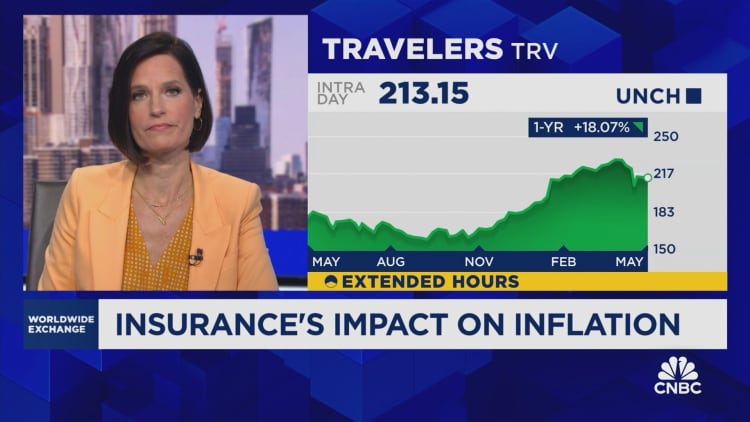
Auto insurance rates are jumping the most since the 1970s, but there could be relief soon

Soaring auto insurance costs have been a principle driver behind inflation over the past year, but there could be relief on the way, according to Bank of America. Motor vehicle insurance cost was up 22.6% from a year ago, the largest annual increase since 1979, according to Bank of America. Recent trends probably do not “mean that your premium will fall, but we think the rate of increase should slow,” BofA economist Stephen Juneau said. Rows of new Tesla cars are seen in a holding area near a customer collection point on April 15, 2024 in London, England. Leon Neal | Getty Images

Soaring auto insurance costs have been a principle driver behind inflation over the past year, but there could be relief on the way, according to Bank of America.

The bank’s economists see several driving factors behind the run-up in costs to ease in the months ahead, possibly taking some of the heat off a category that has pushed the Federal Reserve to keep up its inflation fight.

“The turbocharged increases in motor vehicle insurance premiums are a response to underwriting losses in the industry. Insurers saw losses,” BofA economist Stephen Juneau said in a note. However, he added, “There are signs that many insurers are getting back to profitability.”

Primarily, the hit to insurers, which has been passed on to consumers, arose from three sources: higher vehicle prices, increased costs for repairs and “more accidents as driving trends returned to normal,” Juneau said.

There’s some good news on that front.

Sales prices for new and used vehicles have been trending lower in recent months and are down 0.4% and 6.9%, respectively, on a 12-month basis, according to Bureau of Labor Statistics data through April. Also, repair and maintenance services costs were flat in April though still up 7.6% from a year ago.

Motor vehicle insurance costs, though, continued to soar.

The category rose 1.8% in April on a monthly basis and was up 22.6% from a year ago, the largest annual increase since 1979, according to Bank of America.

In the CPI calculation, auto insurance has a weighting of nearly 3%, so it’s a significant component.

The recent trends probably do not “mean that your premium will fall, but we think

CNBC
Nvidia shares pop 10% to record high after forecast signals unwavering demand for AI chips

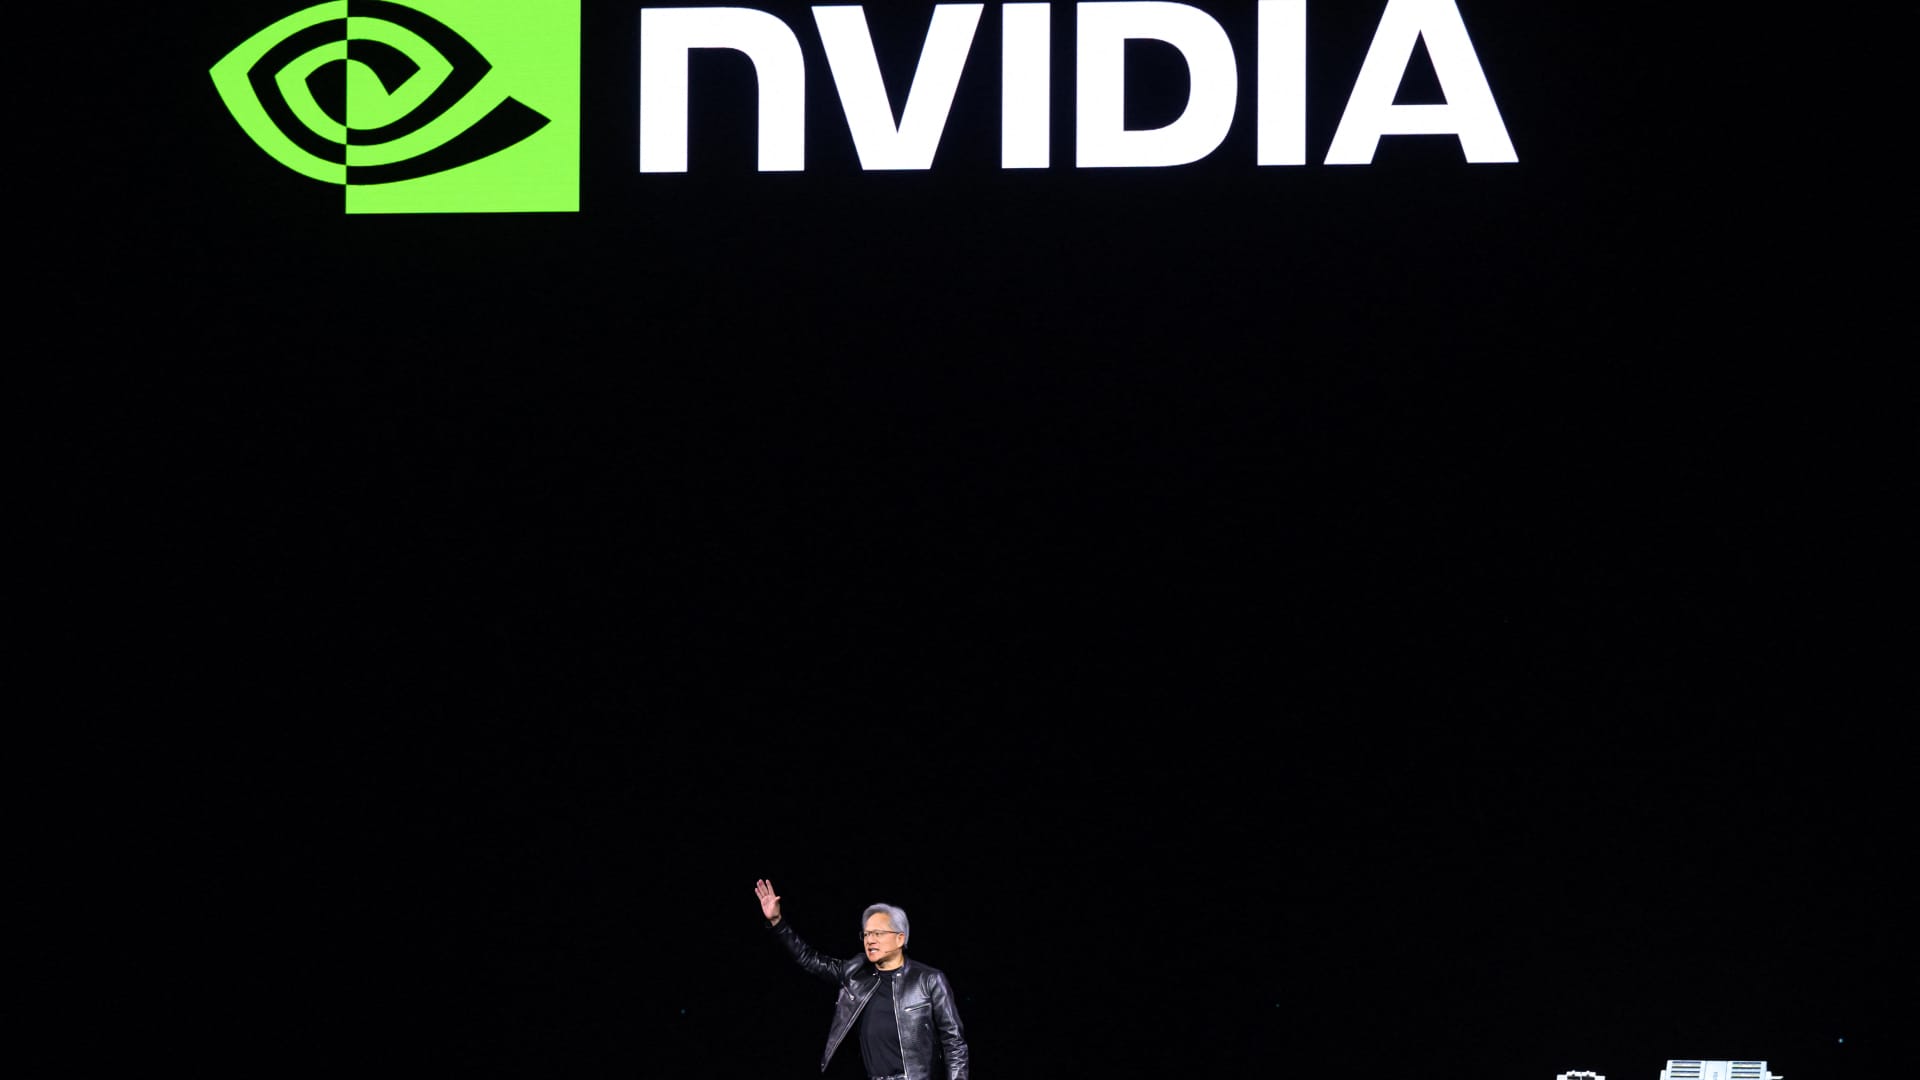
Nvidia shares surged to a record high Thursday after the company beat earnings and revenue estimates for the fiscal first quarter. The chipmaker also announced a 10-for-1 stock split on Wednesday in its report. Wall Street analysts have since grown more bullish following the results. Nvidia CEO Jensen Huang delivers a keynote address during the Nvidia GTC Artificial Intelligence Conference at SAP Center on March 18, 2024 in San Jose, California.  Justin Sullivan | Getty Images

Nvidia shares jumped more than 10% on Thursday after the company on Wednesday reported earnings that topped Wall Street estimates and showed that there’s still ferocious demand for its artificial intelligence chips. The company’s data center revenue grew by a whopping 427% during the quarter.

First-quarter revenue came in higher than expected at $26.04 billion compared with the LSEG estimate of $24.65 billion. And the demand isn’t wavering.

The company issued strong guidance, saying it expects $28 billion in revenue for the current quarter, beating the LSEG estimate of $26.61 billion.

Shares passed $1,000 for the first time, reaching an all-time high of $1,051.96 during intraday trading, and are up about 111% this year. Its previous high of $953.86 was set on May 21.

Despite some analysts fearing an “air pocket,” others have grown even more bullish on the company since its results. Bernstein’s Stacy Rasgon increased the firm’s price target to $1,300, writing in a note to investors that the narrative surrounding the company is “clearly nowhere near its end, or likely nowhere near its peak.” He wrote that shares seem inexpensive.

Jefferies raised its target on the stock to $1,350 due to a strong ramp for its new AI graphics processors called Blackwell and anticipation of an acceleration in “magnitude of beats” later this year when the platform launches.

Nvidia posted net income of $14.88 billion, or $5.98 per share, a dramatic pop from the $2.04 billion, or 82 cents per share, it reported in the year-ago quarter.

Nvidia on Wednesday announced a 10-for-1 stock split, with shares set to begin trading on a split-adjusted basis at market open on June 10.

CNBC

‘WhaT doeS tHe ElecTIoN meaN for the FTSE?’

Standard DigitalWeekend Print + Standard Digital

wasnow $75 per month

Complete digital access to quality FT journalism with expert analysis from industry leaders. Pay a year upfront and save 20%.

What’s included

Global news & analysisExpert opinionFT App on Android & iOSFT Edit appFirstFT: the day’s biggest stories20+ curated newslettersFollow topics & set alerts with myFTFT Videos & Podcasts20 monthly gift articles to shareLex: FT’s flagship investment column15+ Premium newsletters by leading expertsFT Digital Edition: our digitised print editionWeekday Print EditionFT WeekendFT Digital EditionGlobal news & analysisExpert opinionSpecial featuresExclusive FT analysisFT Digital EditionGlobal news & analysisExpert opinionSpecial featuresExclusive FT analysisGlobal news & analysisExpert opinionFT App on Android & iOSFT Edit appFirstFT: the day’s biggest stories20+ curated newslettersFollow topics & set alerts with myFTFT Videos & Podcasts10 monthly gift articles to shareGlobal news & analysisExpert opinionFT App on Android & iOSFT Edit appFirstFT: the day’s biggest stories20+ curated newslettersFollow topics & set alerts with myFTFT Videos & Podcasts20 monthly gift articles to shareLex: FT’s flagship investment column15+ Premium newsletters by leading expertsFT Digital Edition: our digitised print editionEverything in PrintWeekday Print EditionFT WeekendFT Digital EditionGlobal news & analysisExpert opinionSpecial featuresExclusive FT analysisPlusEverything in Premium DigitalEverything in Standard DigitalGlobal news & analysisExpert opinionSpecial featuresFirstFT newsletterVideos & PodcastsFT App on Android & iOSFT Edit app10 gift articles per monthExclusive FT analysisPremium newslettersFT Digital Edition10 additional gift articles per monthMake and share highlightsFT WorkspaceMarkets data widgetSubscription ManagerWorkflow integrationsOccasional readers go freeVolume discountFT Weekend Print deliveryPlusEverything in Standard DigitalFT Weekend Print deliveryPlusEverything in Premium Digital

Hargreaves Lansdown bid shows wealth managers as private equity target

Standard DigitalWeekend Print + Standard Digital

wasnow $85 per month

Billed Quarterly at $199. Complete digital access plus the FT newspaper delivered Monday-Saturday.

What’s included

Global news & analysisExpert opinionFT App on Android & iOSFT Edit appFirstFT: the day’s biggest stories20+ curated newslettersFollow topics & set alerts with myFTFT Videos & Podcasts20 monthly gift articles to shareLex: FT’s flagship investment column15+ Premium newsletters by leading expertsFT Digital Edition: our digitised print editionWeekday Print EditionFT WeekendFT Digital EditionGlobal news & analysisExpert opinionSpecial featuresExclusive FT analysisFT Digital EditionGlobal news & analysisExpert opinionSpecial featuresExclusive FT analysisGlobal news & analysisExpert opinionFT App on Android & iOSFT Edit appFirstFT: the day’s biggest stories20+ curated newslettersFollow topics & set alerts with myFTFT Videos & Podcasts10 monthly gift articles to shareGlobal news & analysisExpert opinionFT App on Android & iOSFT Edit appFirstFT: the day’s biggest stories20+ curated newslettersFollow topics & set alerts with myFTFT Videos & Podcasts20 monthly gift articles to shareLex: FT’s flagship investment column15+ Premium newsletters by leading expertsFT Digital Edition: our digitised print editionEverything in PrintWeekday Print EditionFT WeekendFT Digital EditionGlobal news & analysisExpert opinionSpecial featuresExclusive FT analysisPlusEverything in Premium DigitalEverything in Standard DigitalGlobal news & analysisExpert opinionSpecial featuresFirstFT newsletterVideos & PodcastsFT App on Android & iOSFT Edit app10 gift articles per monthExclusive FT analysisPremium newslettersFT Digital Edition10 additional gift articles per monthMake and share highlightsFT WorkspaceMarkets data widgetSubscription ManagerWorkflow integrationsOccasional readers go freeVolume discountFT Weekend Print deliveryPlusEverything in Standard DigitalFT Weekend Print deliveryPlusEverything in Premium Digital

Global dividends hit Q1 record of $339.2bn

A key driver was strong underlying growth of 6.8%, but the headline figure rose more slowly (2.4%) due to fewer one-off special dividends over the quarter. At the same time, the index found 93% of companies either increased or held their dividends steady in the three-month period. UK dividend outlook ‘healthy but unexciting’ despite cuts to growth forecast Dividends in the US reached an all-time quarterly high of $164.3bn, a 7% increase on an underlying basis. This was attributed to the restoration of Disney’s payout after the pandemic, as well as first Q1 dividends from Meta and T…